Model Results
Dayne Filer & Chris Kassotis
2022-03-02
ModelResults.RmdLoad packages & needed data:
library(kassotis2020)
library(data.table)
data(smryTbl)
data(allScores)
Performance plots
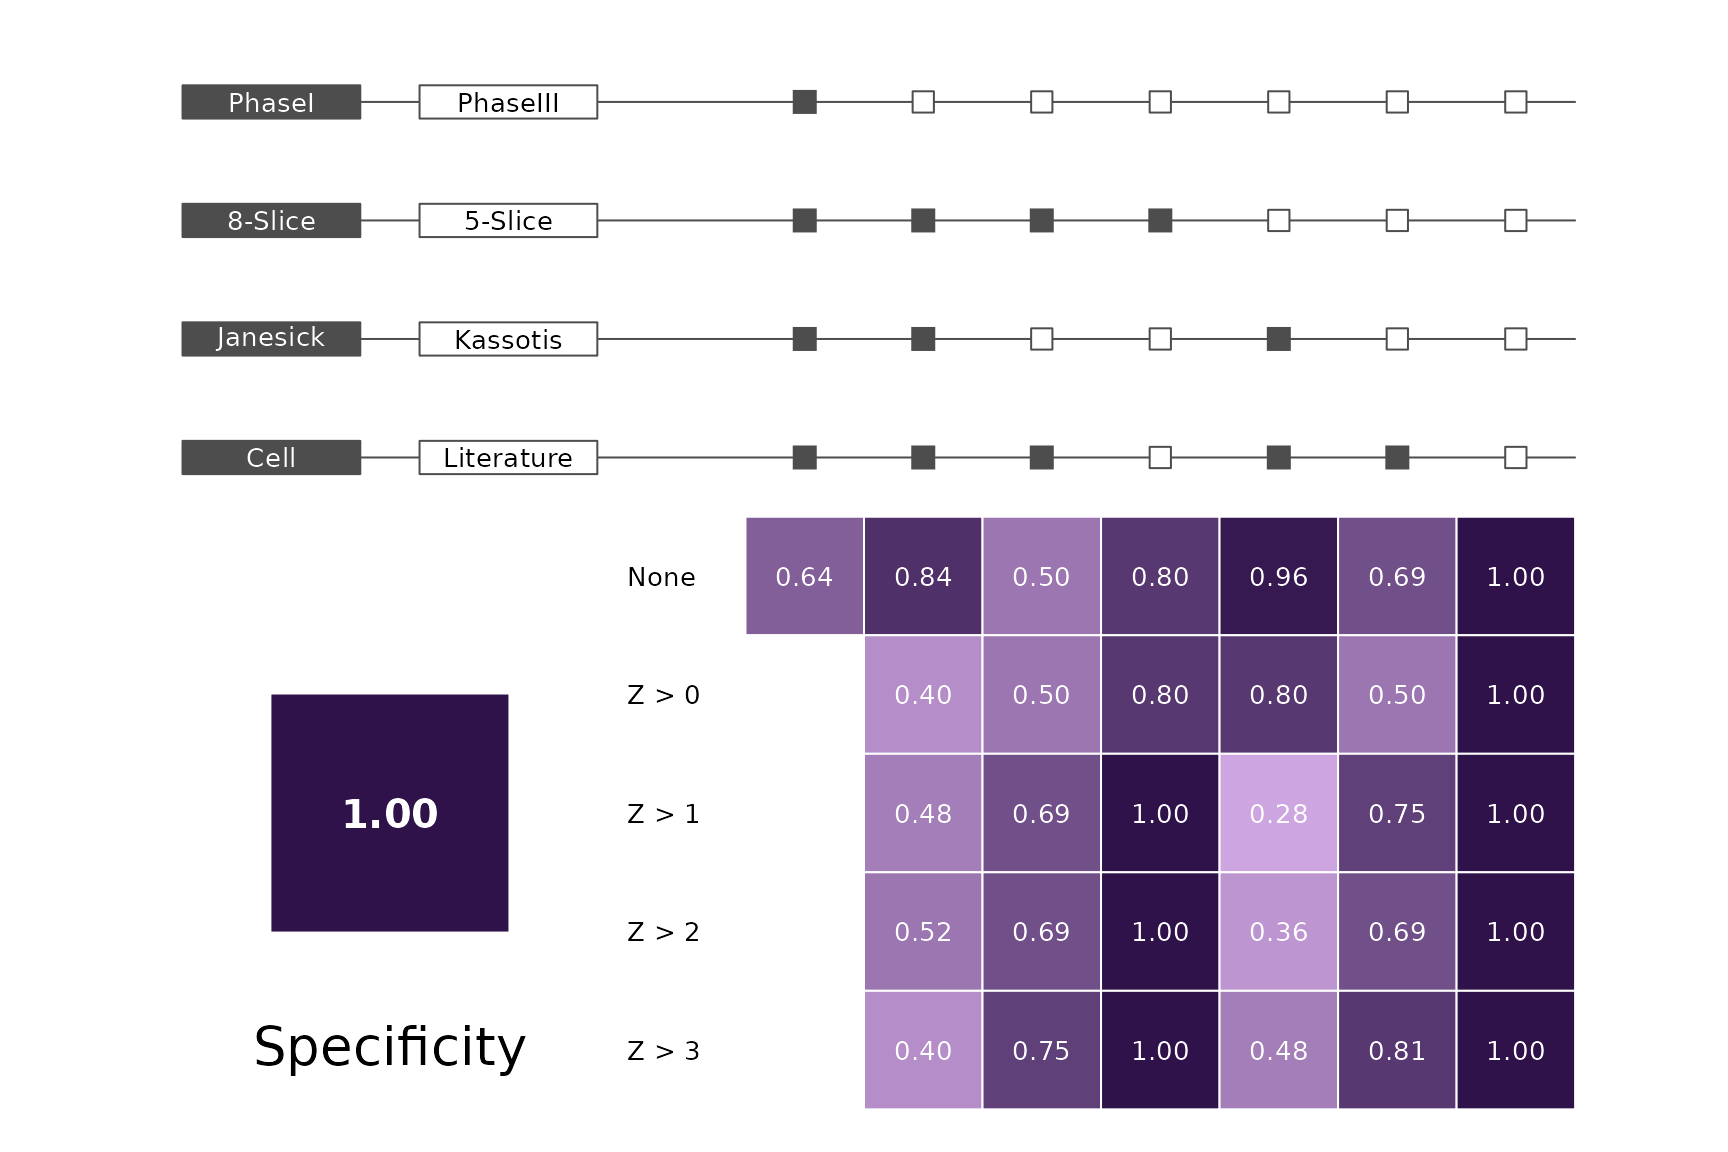
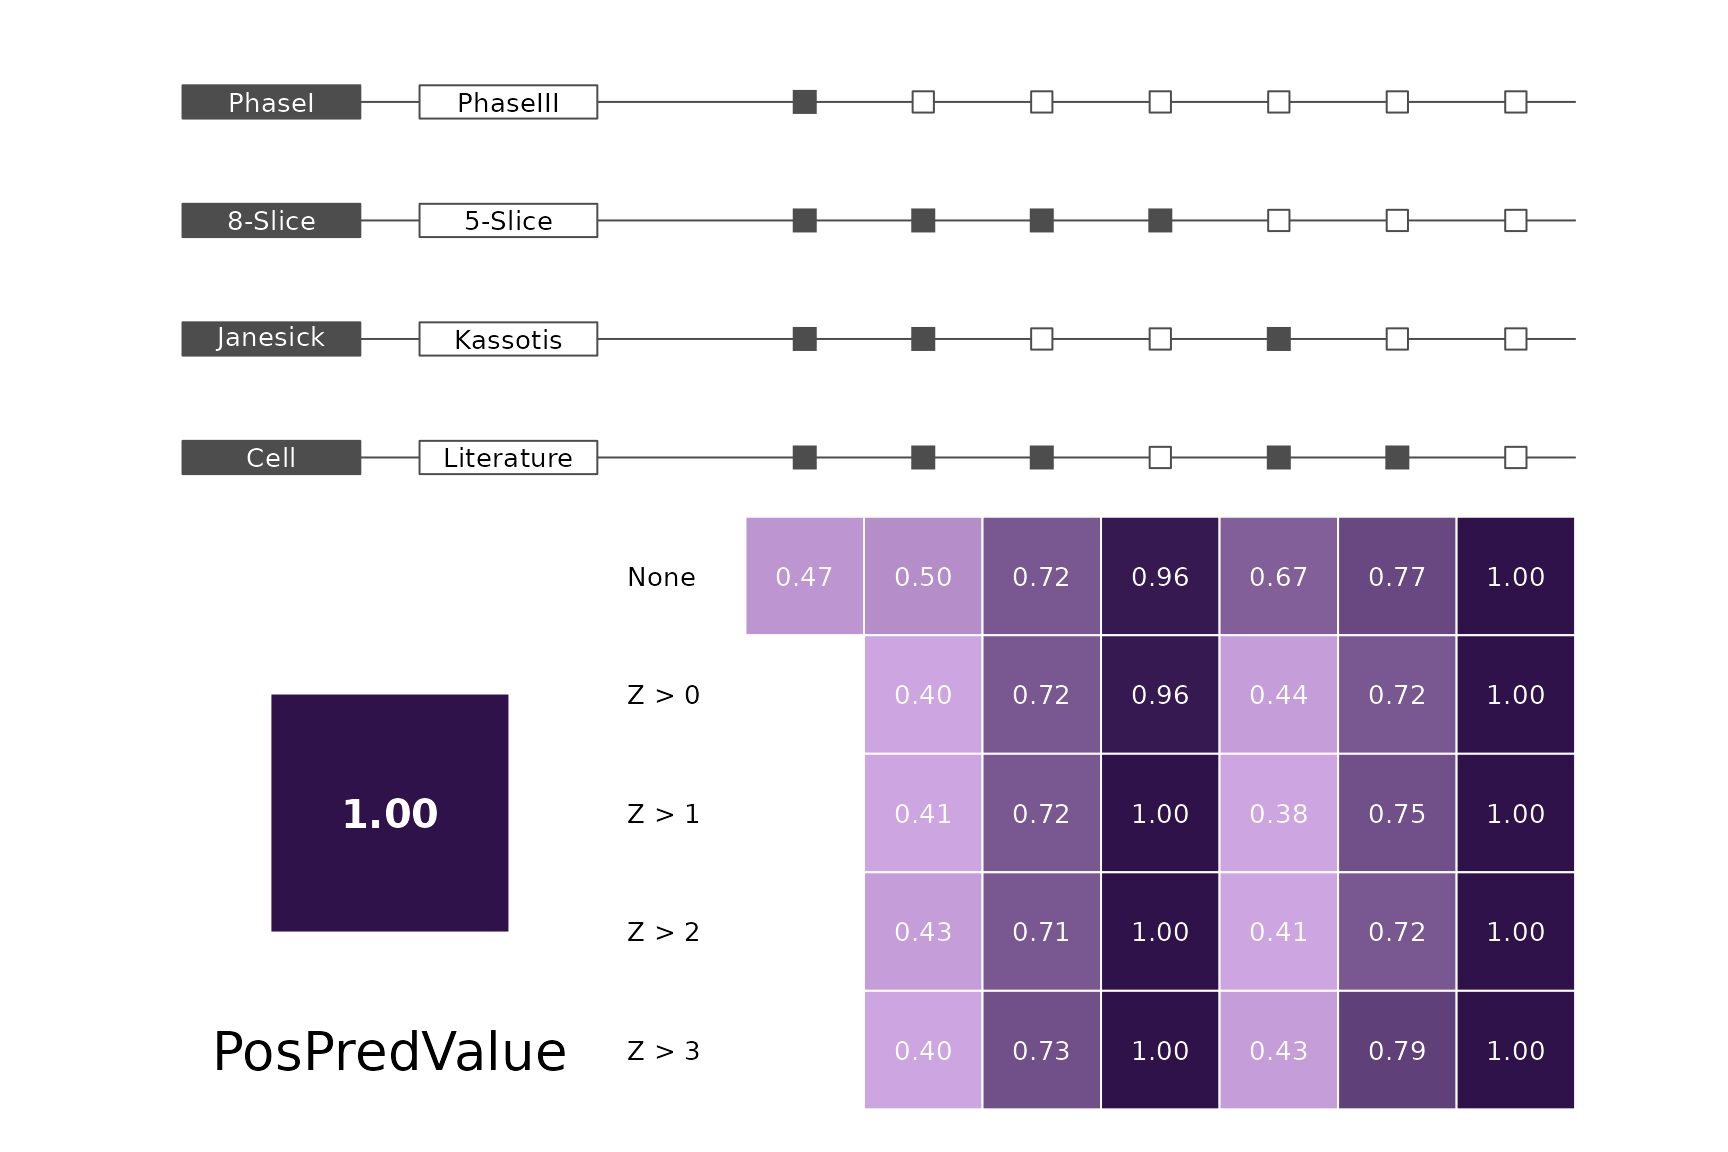
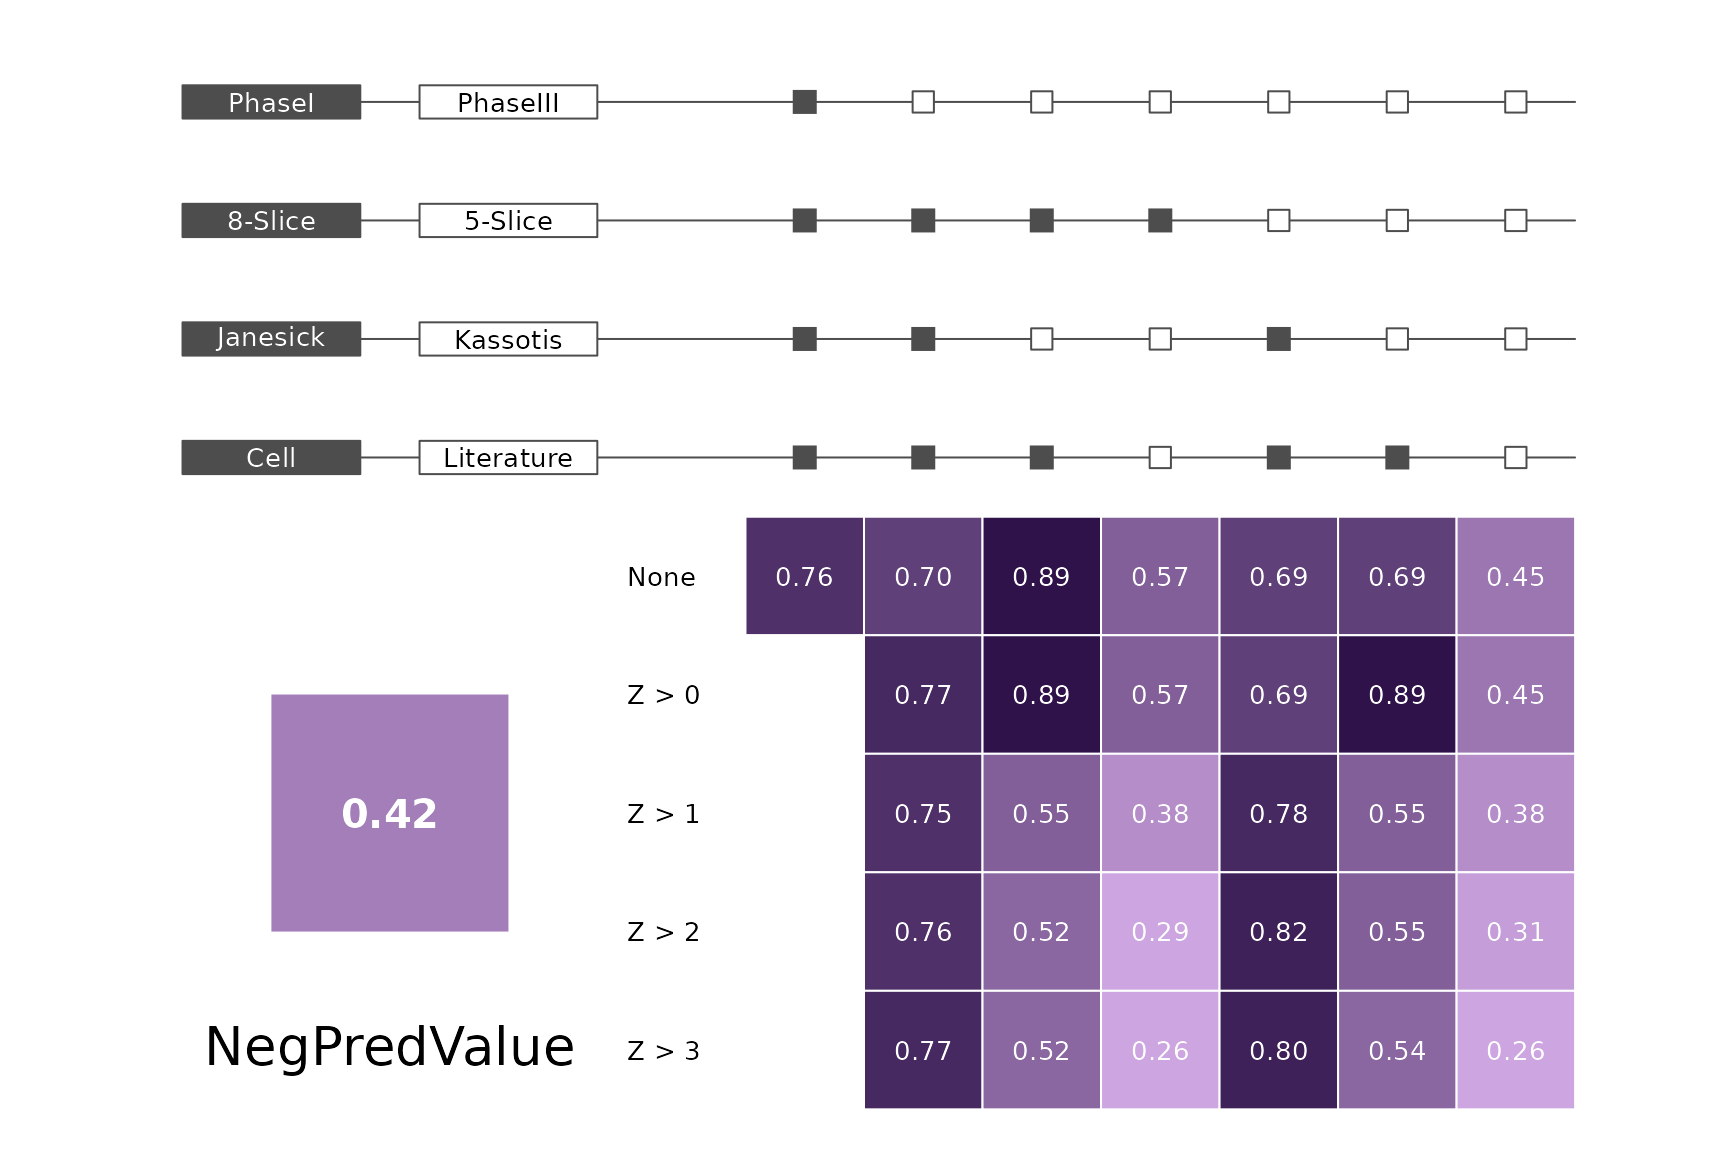
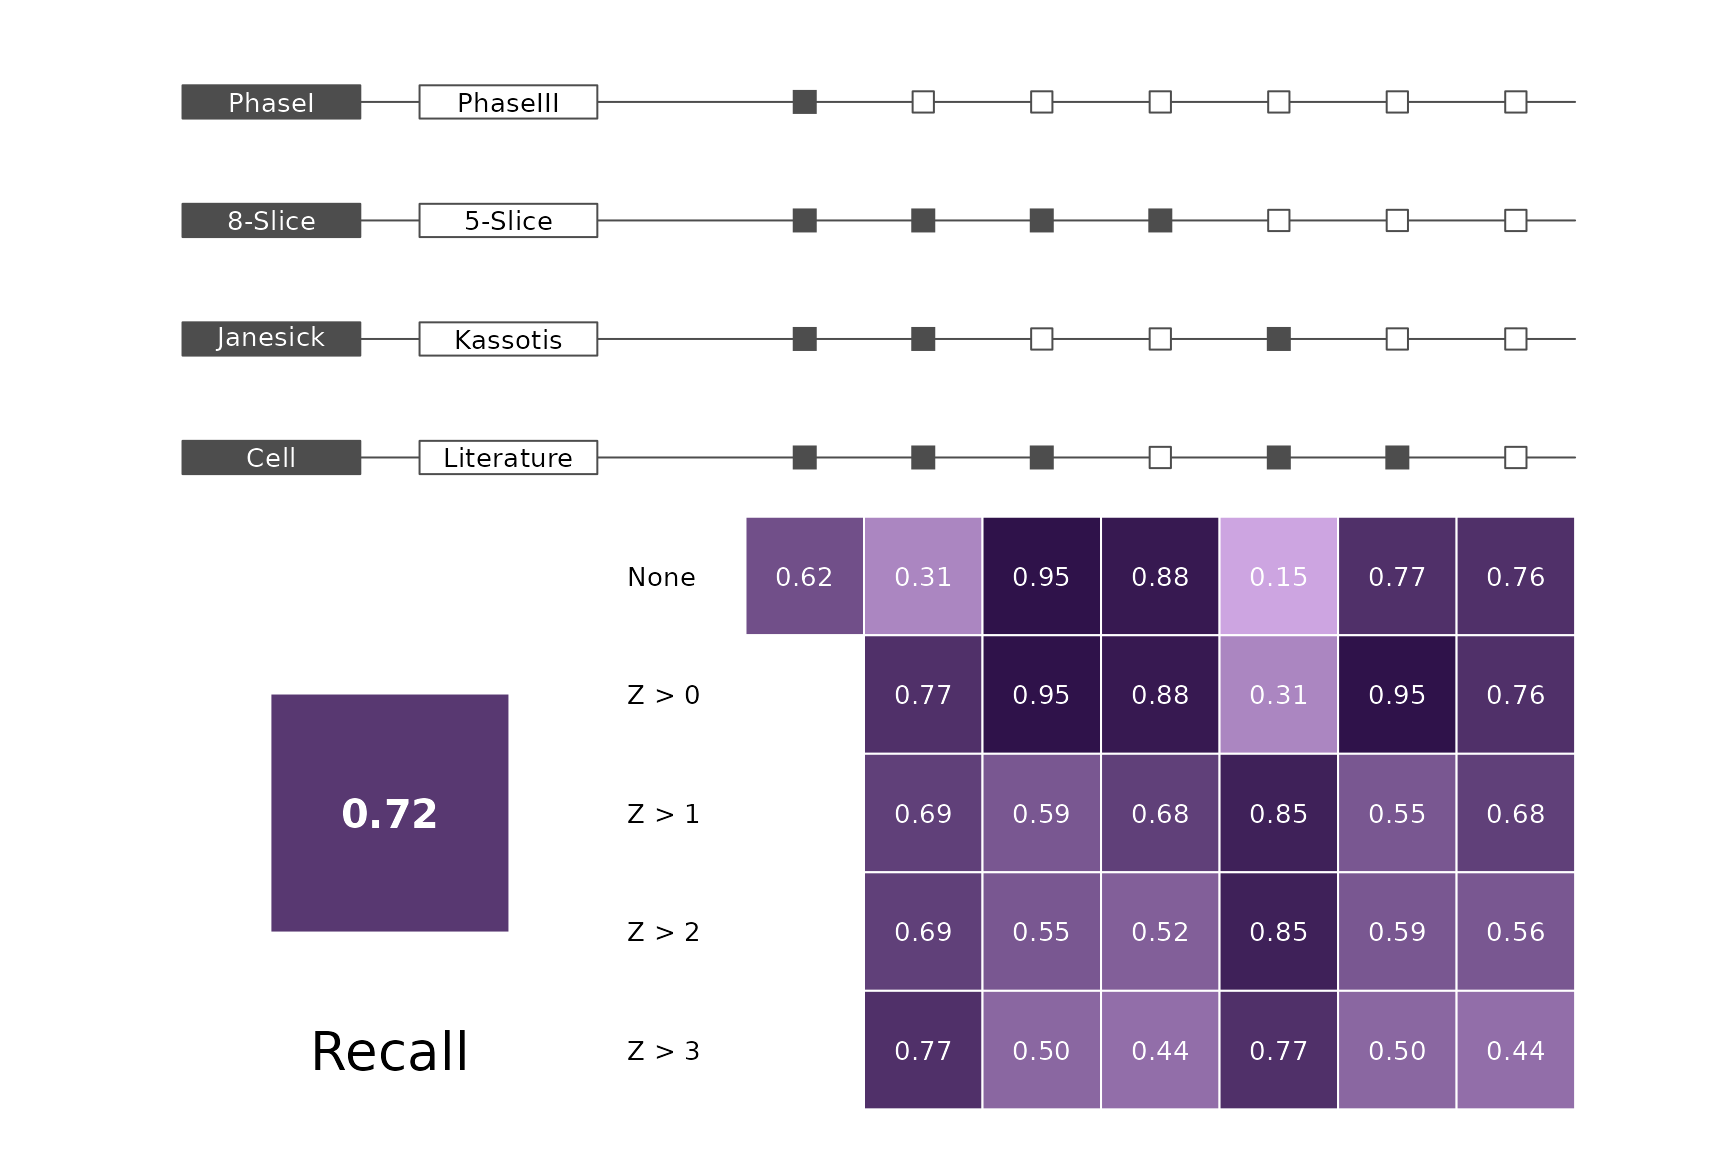
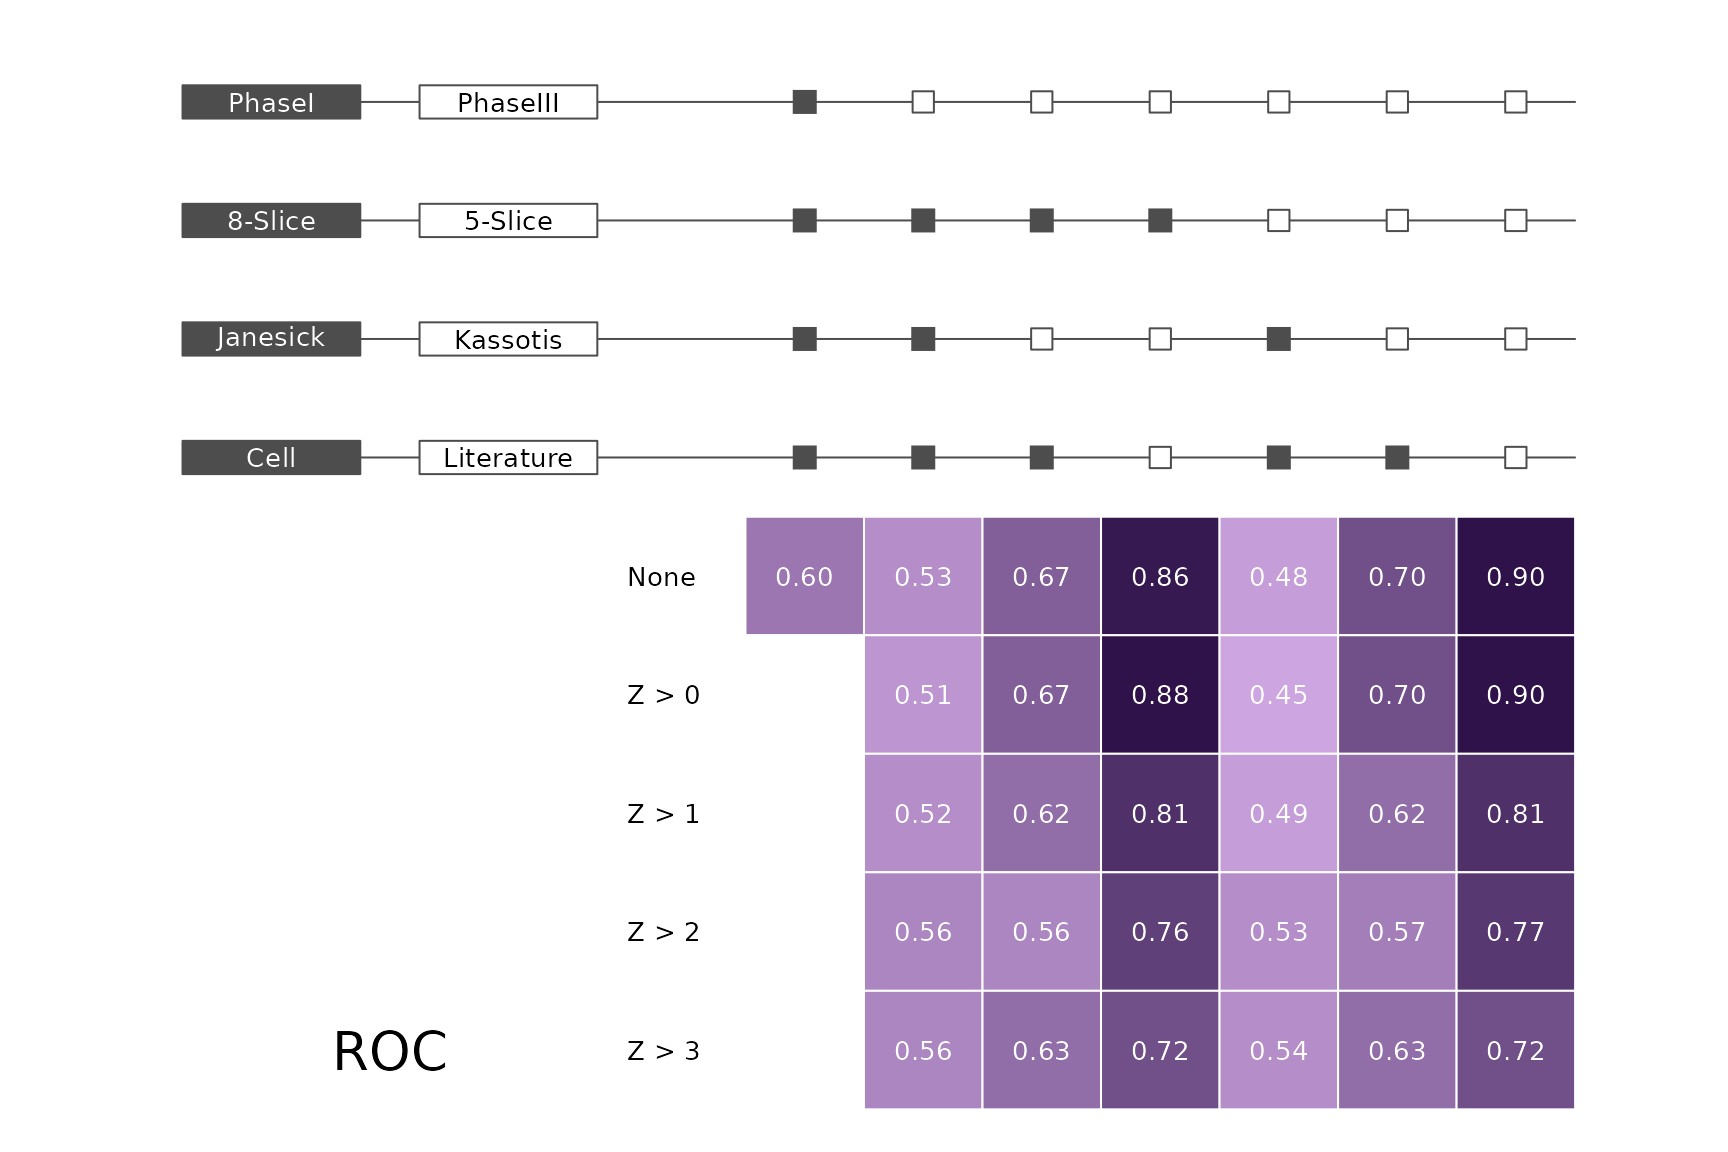
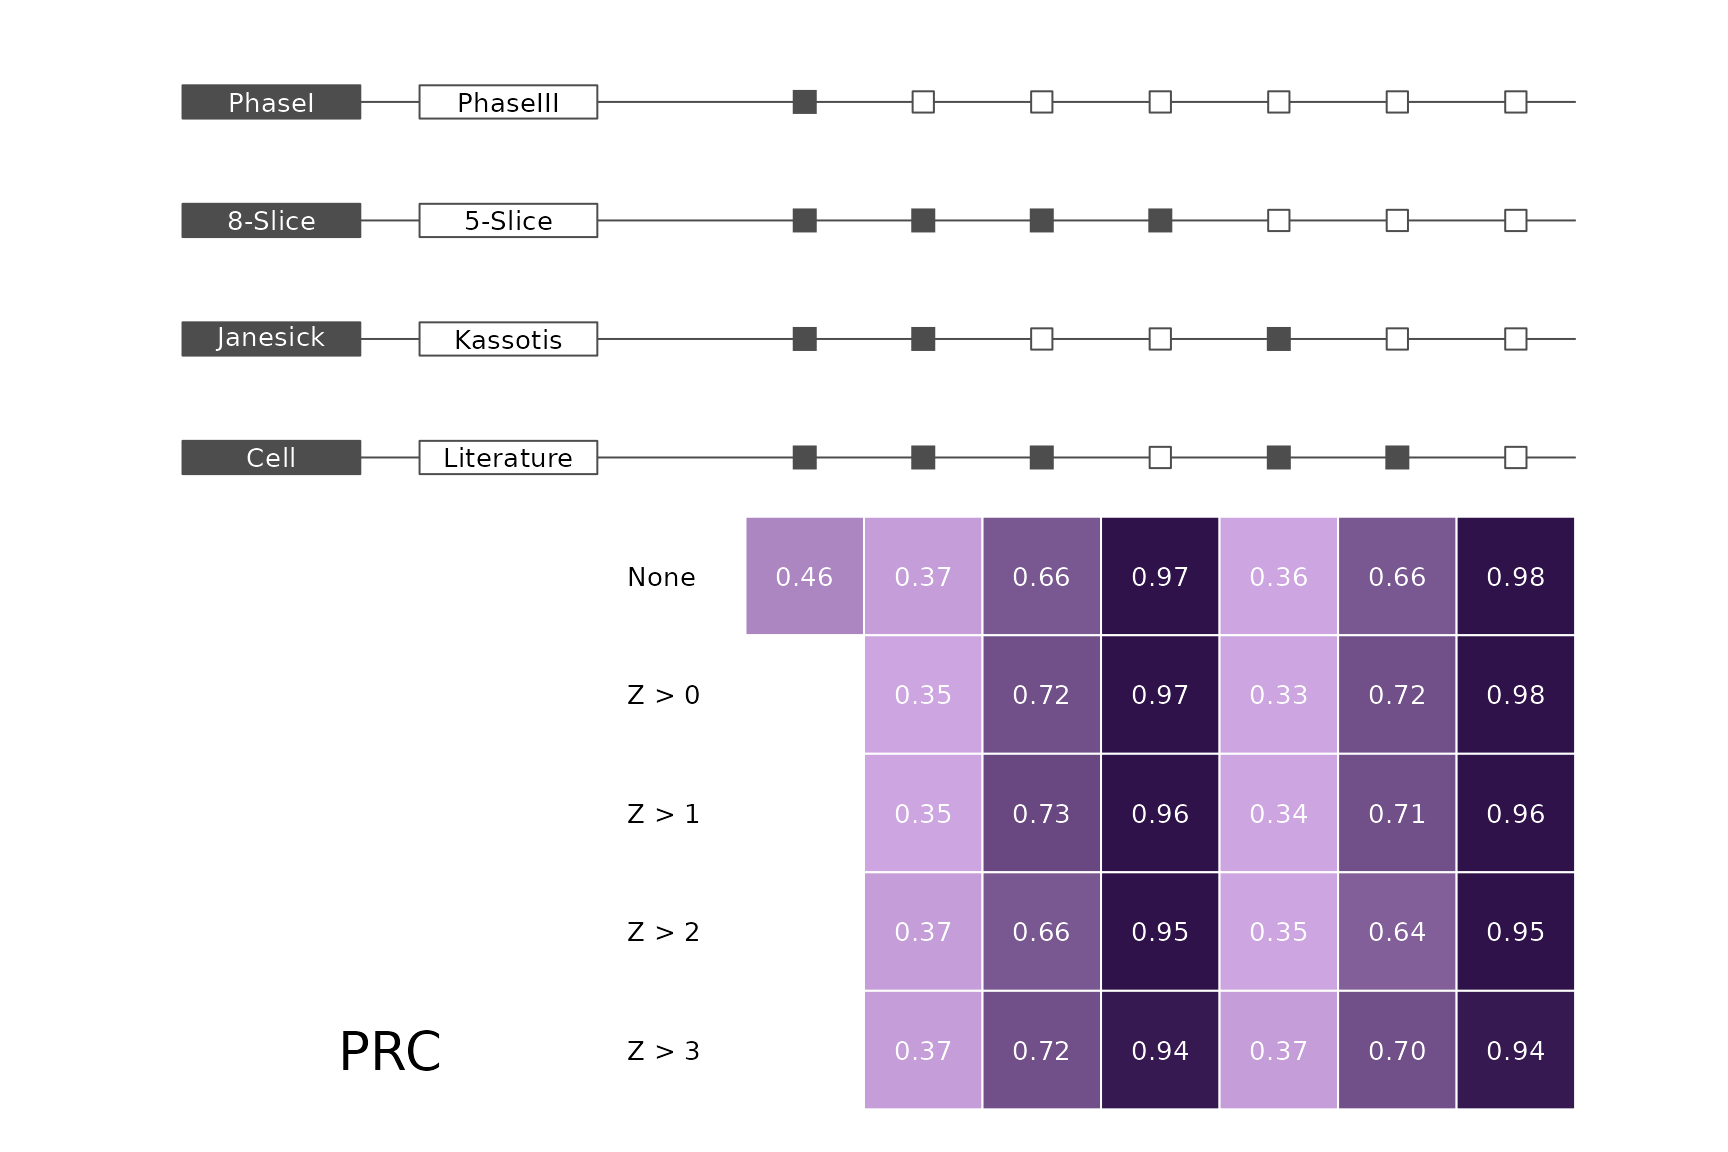
makeMetricPlot <- function(i) {
  metricPlot(i)
  text(x = -2, y = 1.5, labels = i, cex = 2)
}
plts <- c("BalancedAccuracy", "SensPlusSpec", "Sensitivity", "Specificity",
          "PosPredValue", "NegPredValue", "Precision", "Recall", "ROC", "PRC")
for (i in plts) makeMetricPlot(i)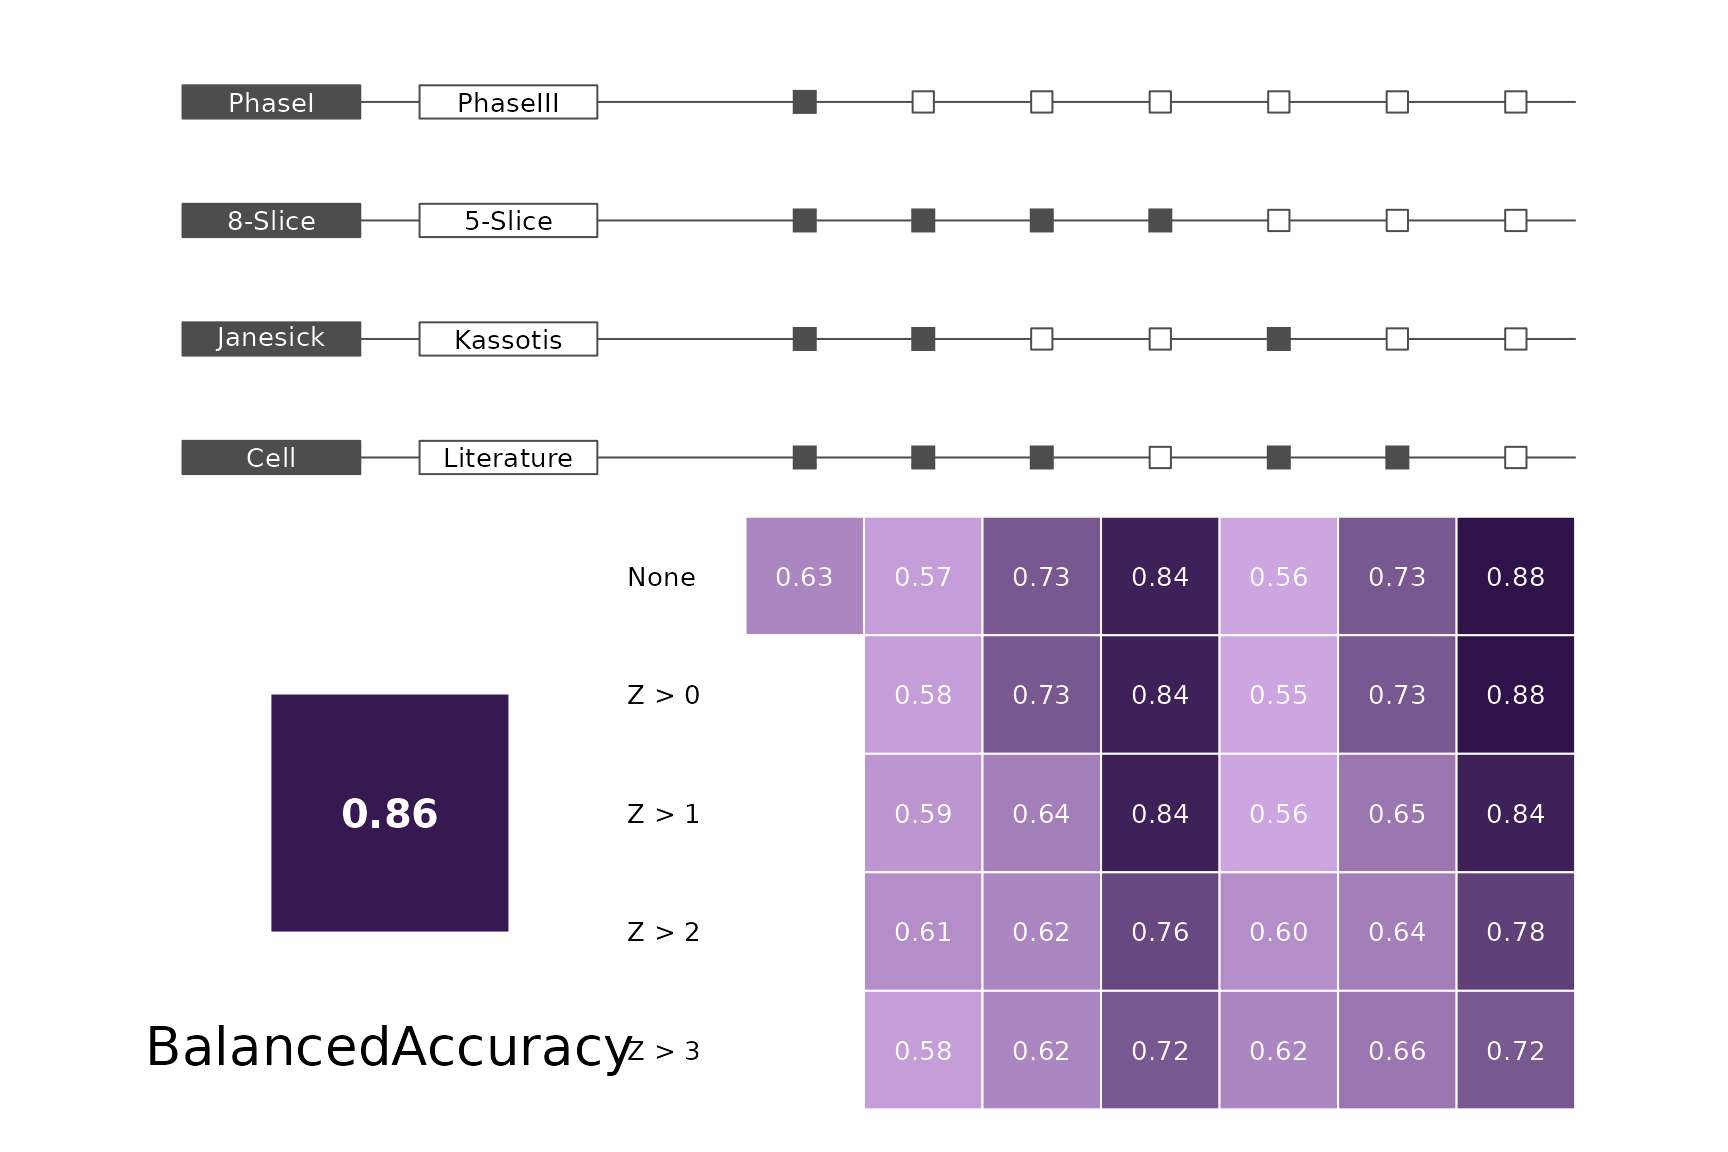


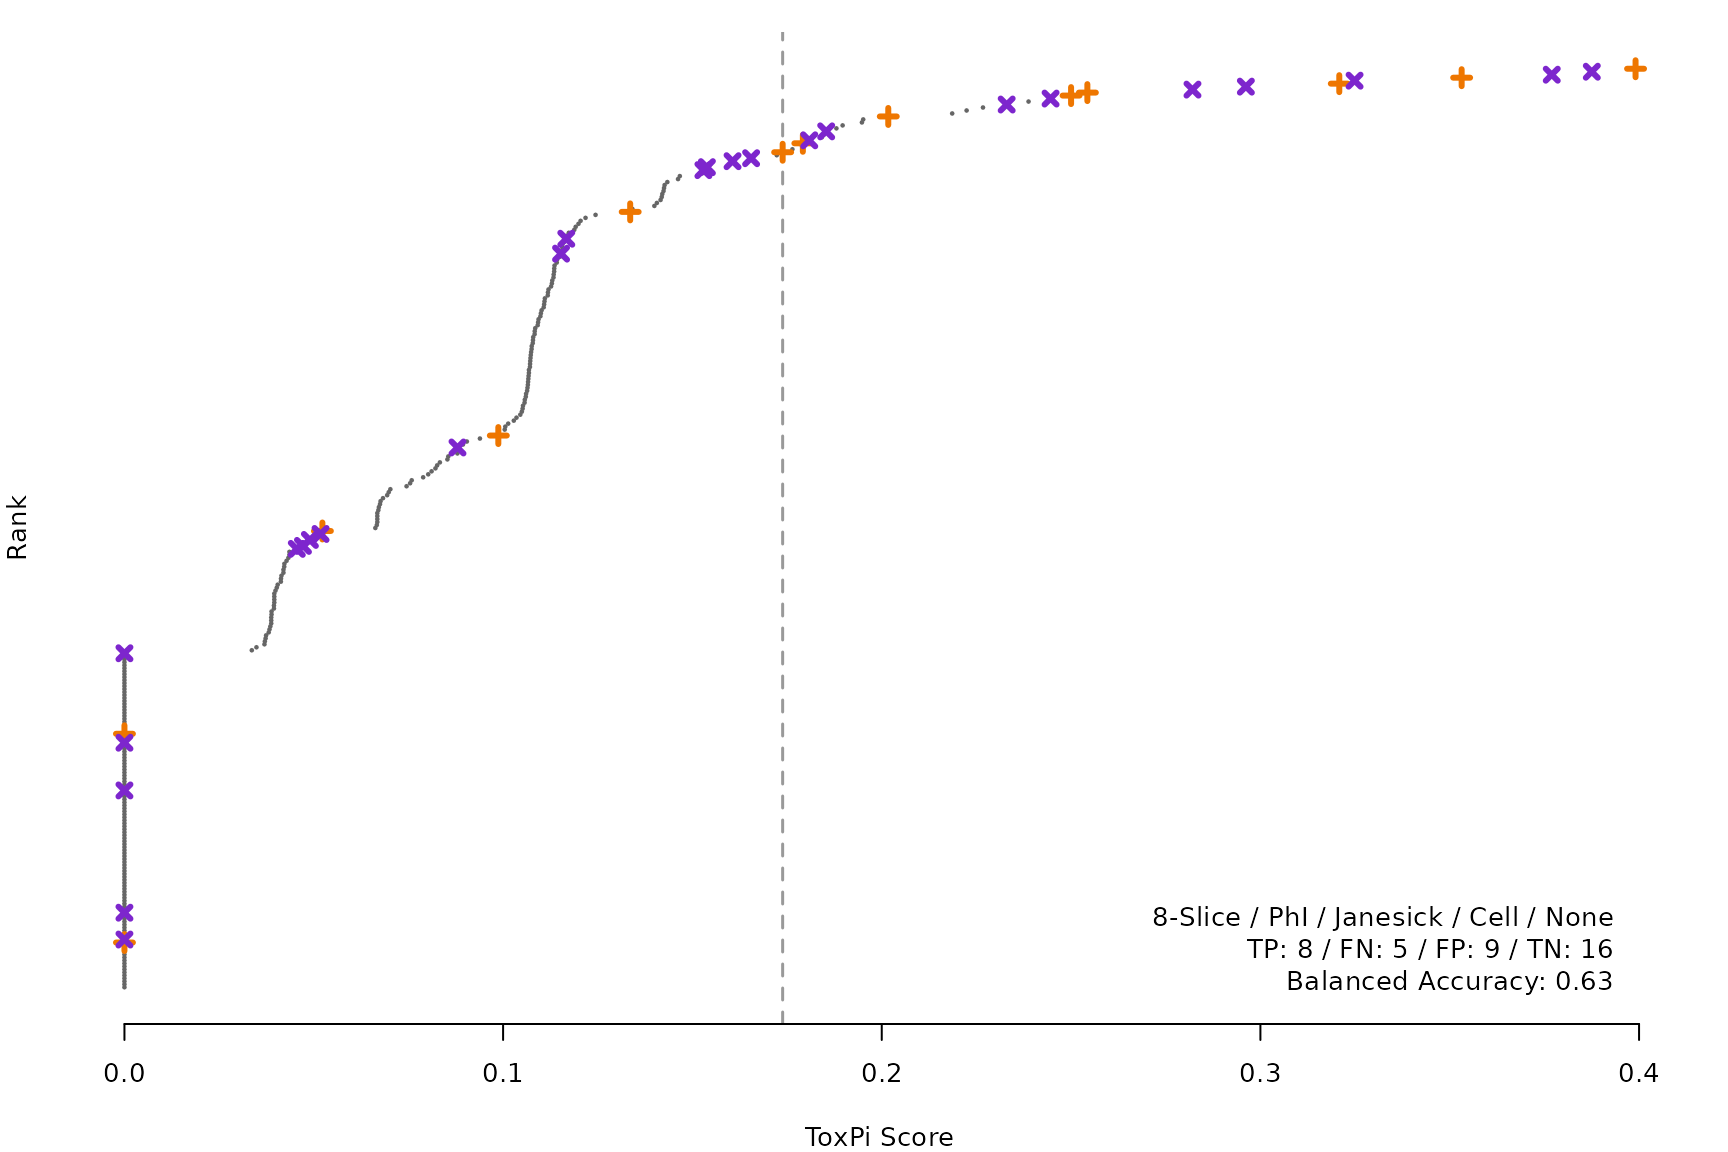
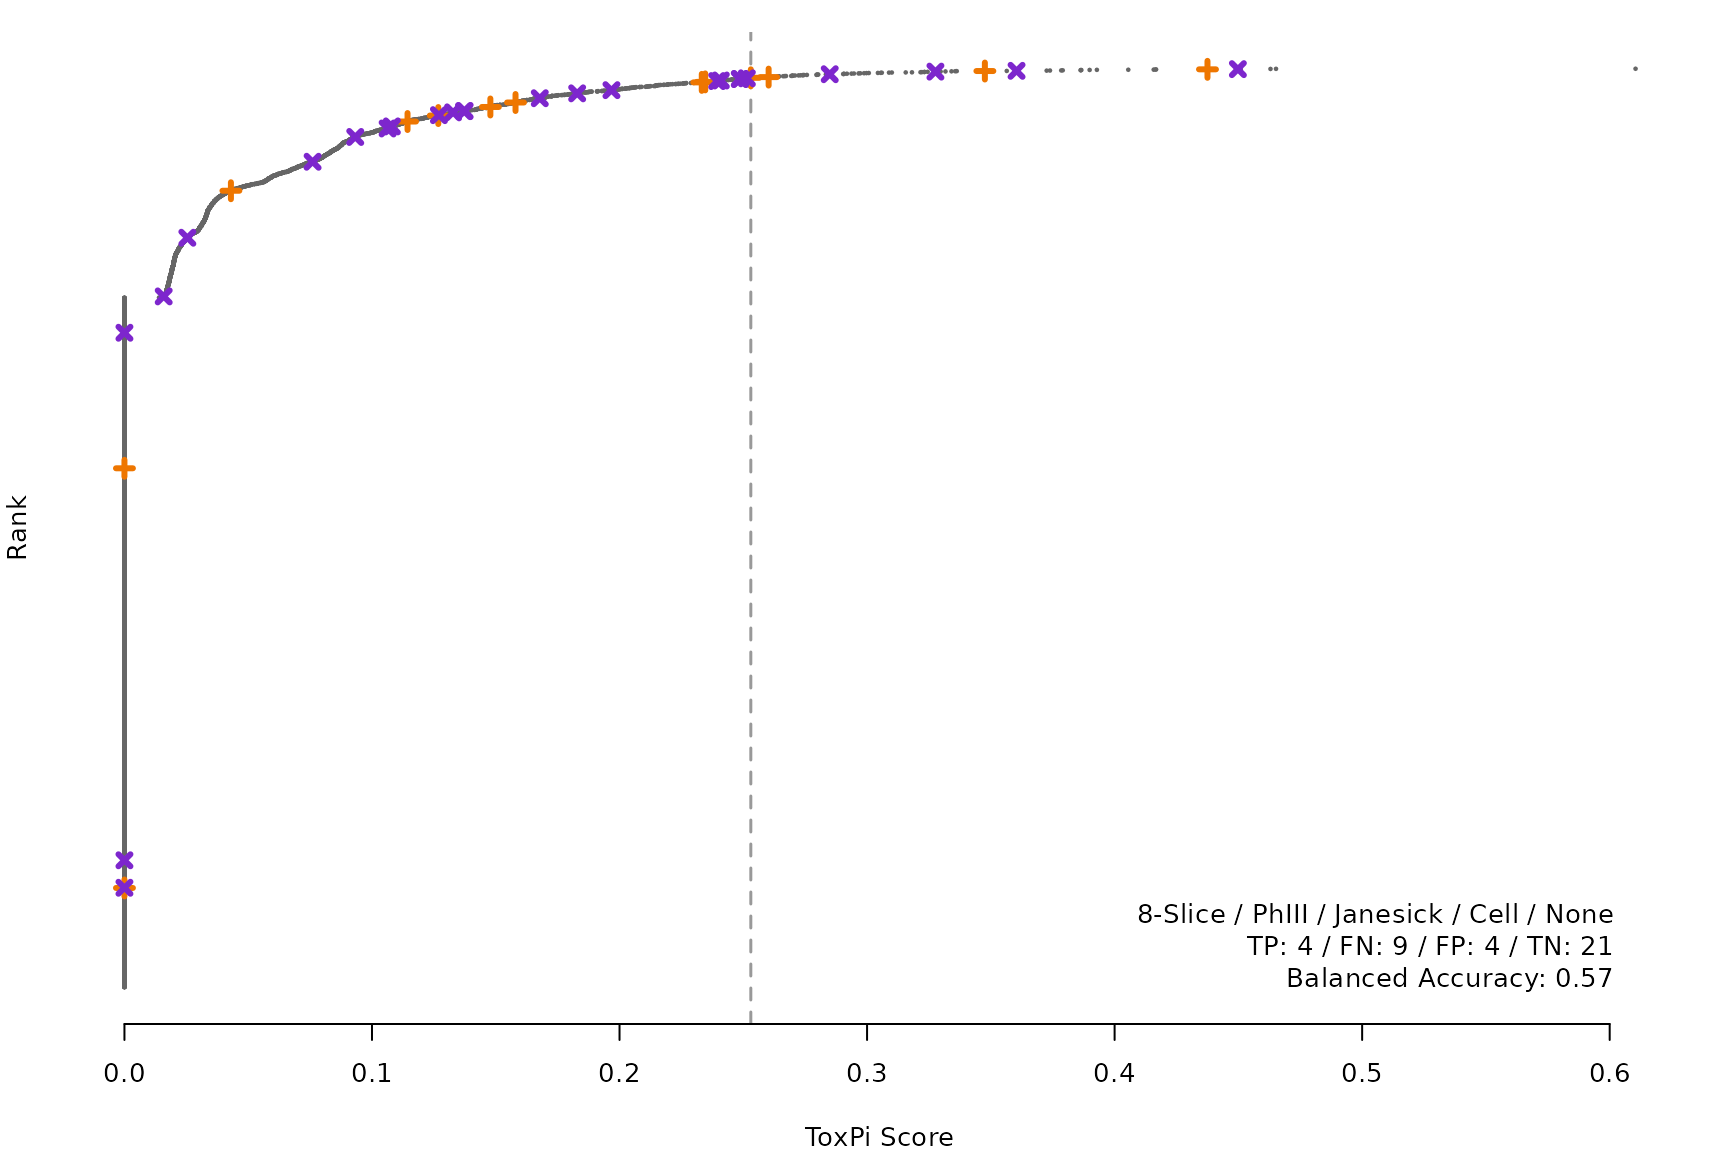
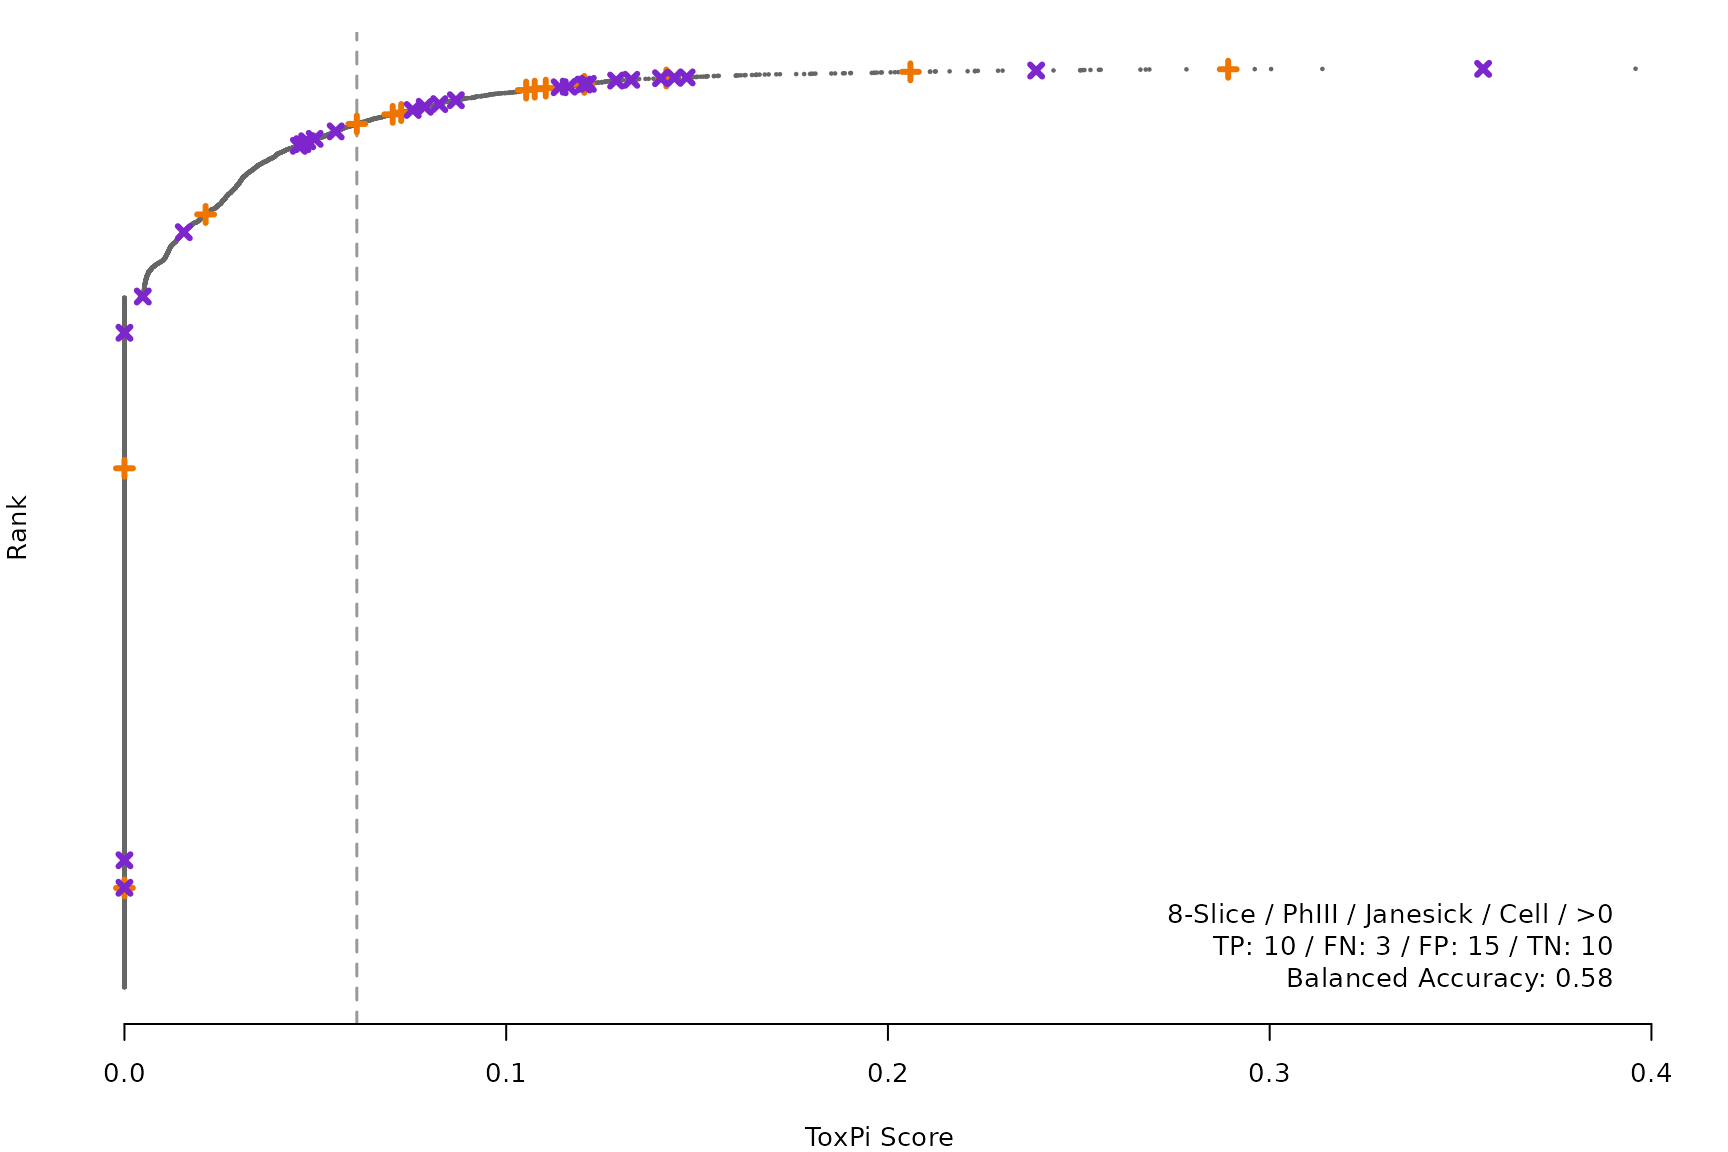
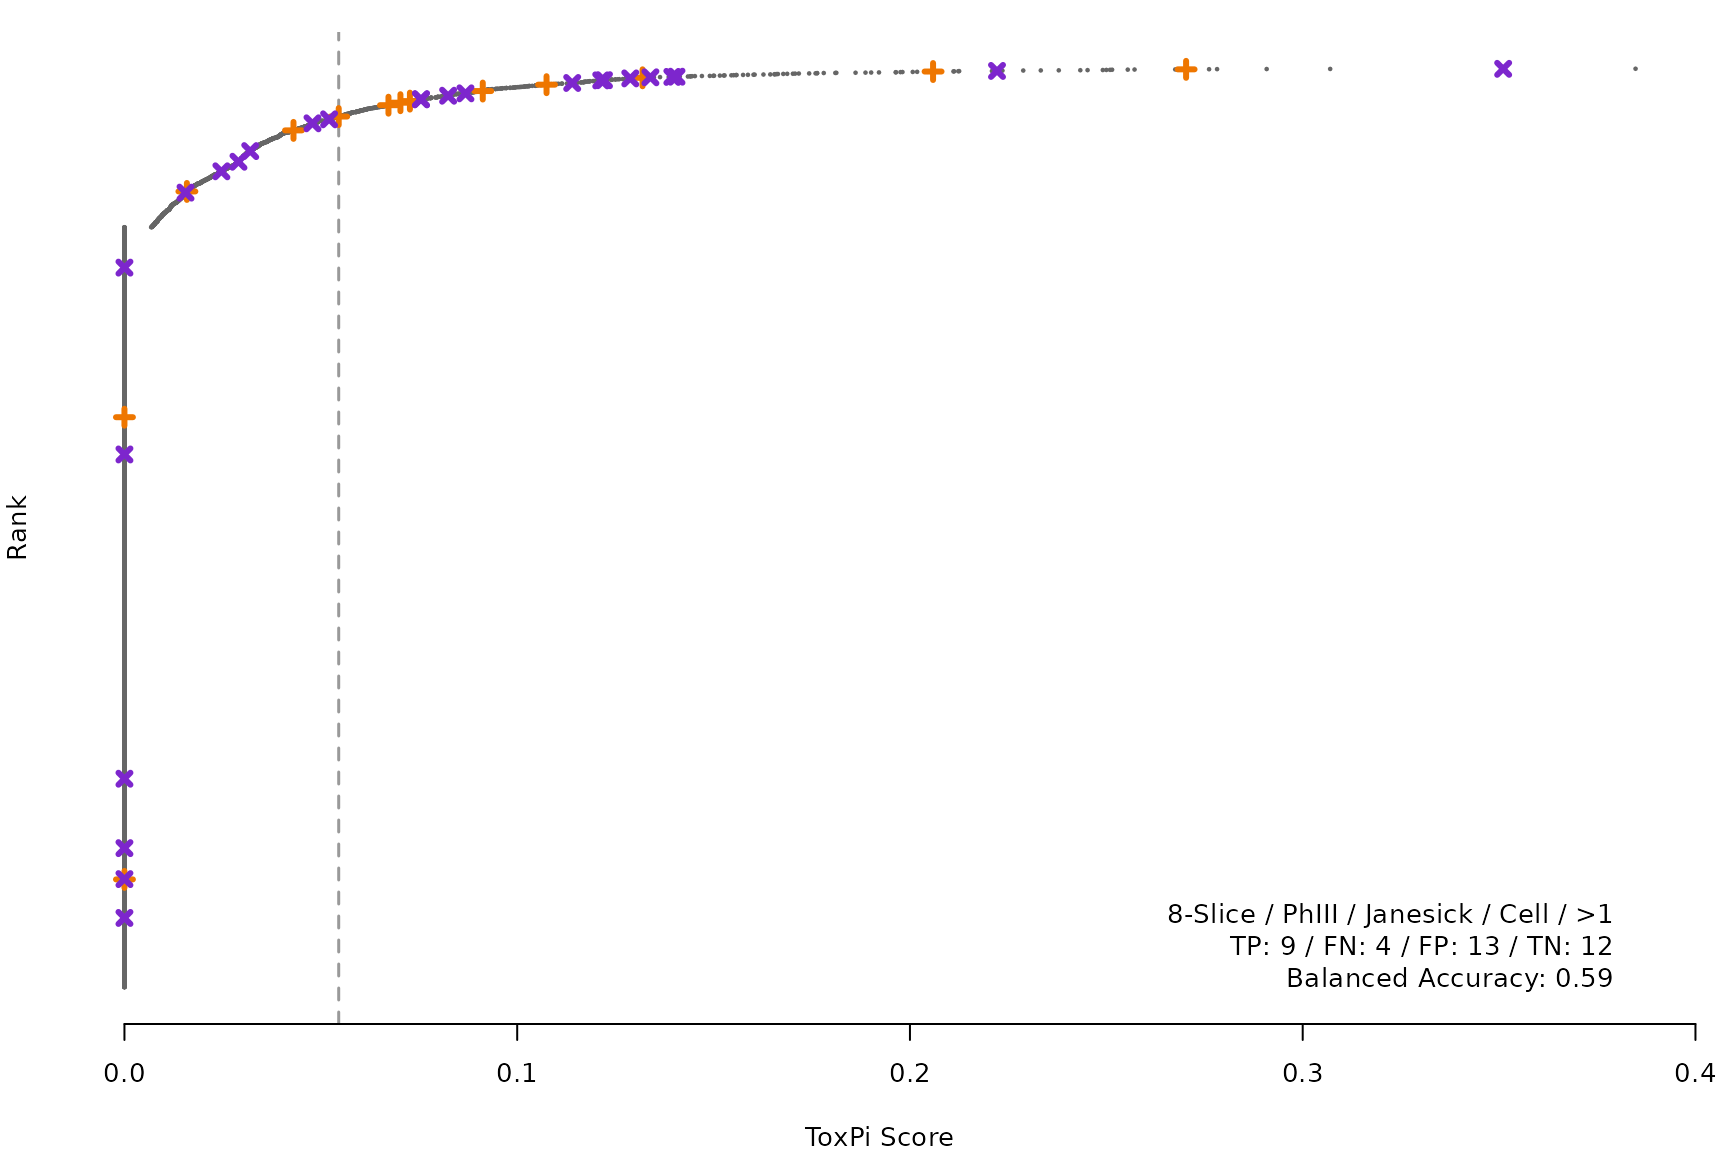
Individual score/rank plots
lbl1 <- c("None", ">0", ">1", ">2", ">3")
lbl2 <- c("Non", "Rm0", "Rm1", "Rm2", "Rm3")
smryTbl[ ,
scr := paste0(ifelse(Model == "8-Slice", "ja", "au"),
ifelse(Phase == "PhI", 1, 3),
lbl2[match(ZScore, lbl1)])]
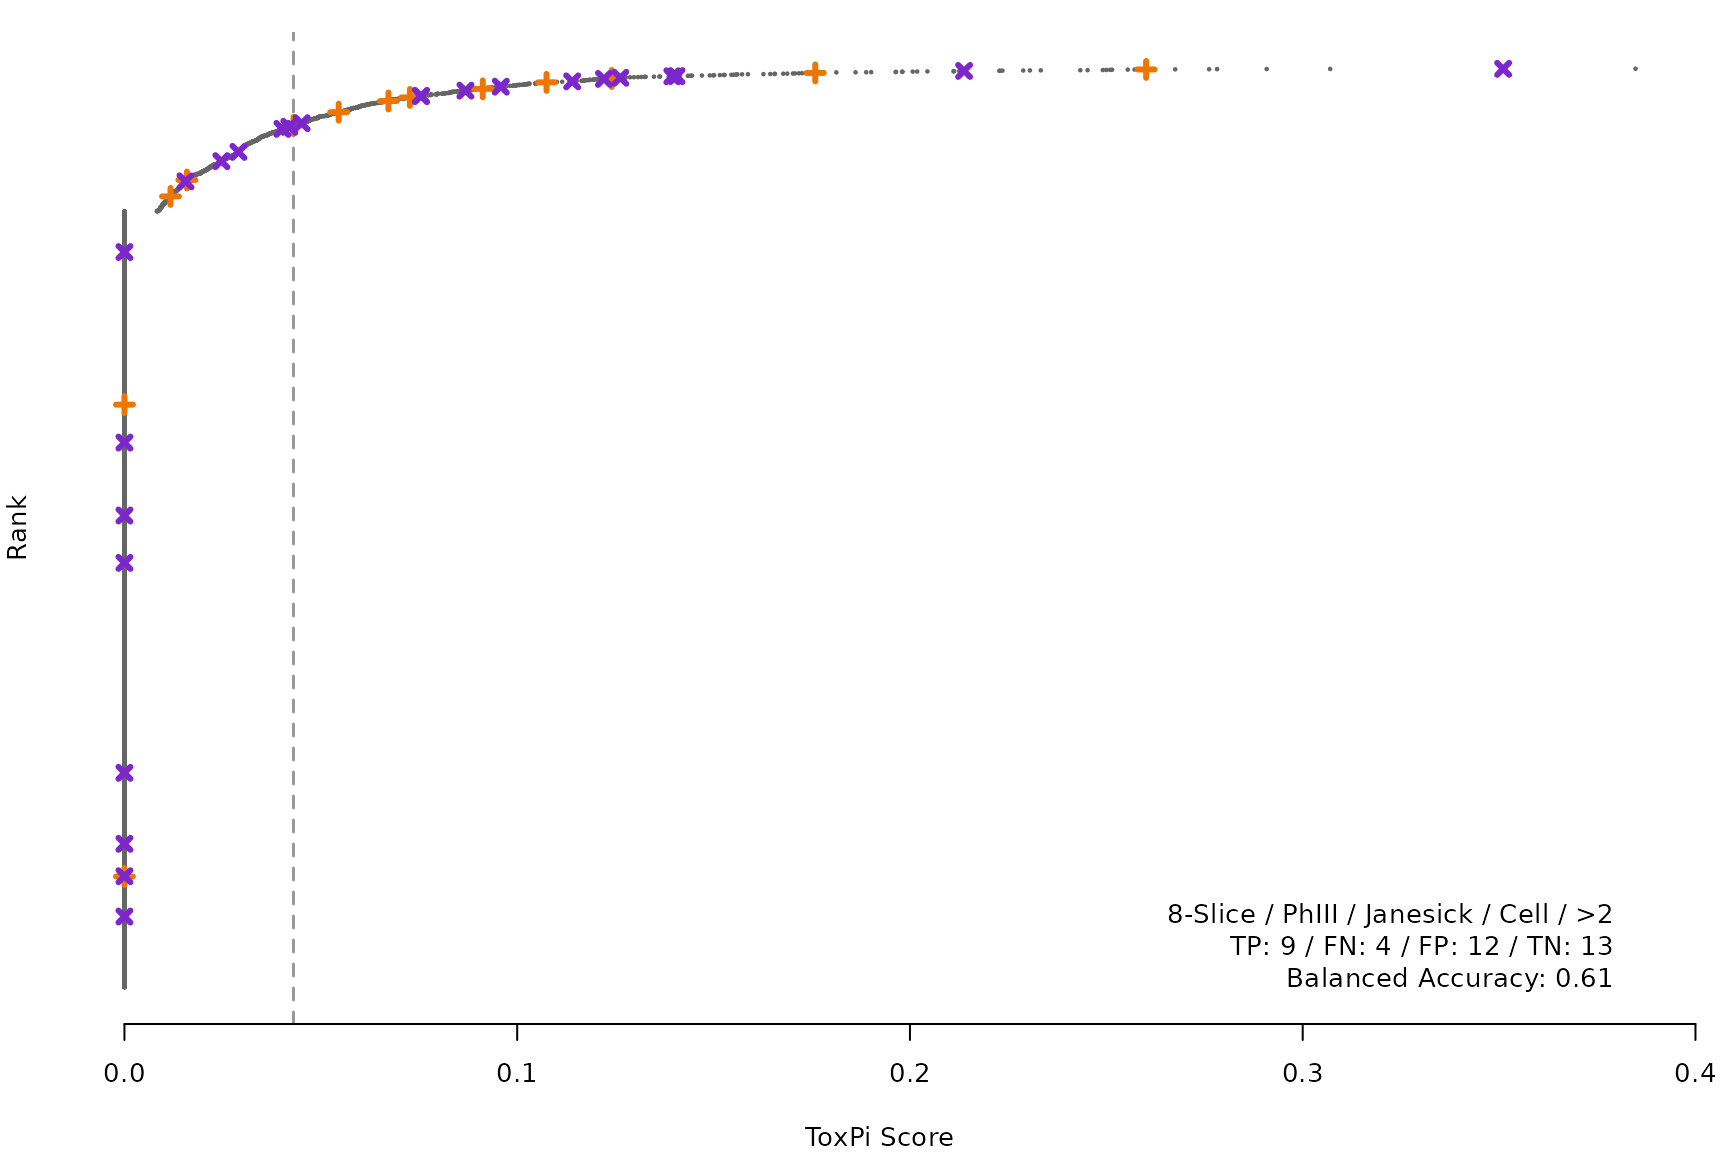
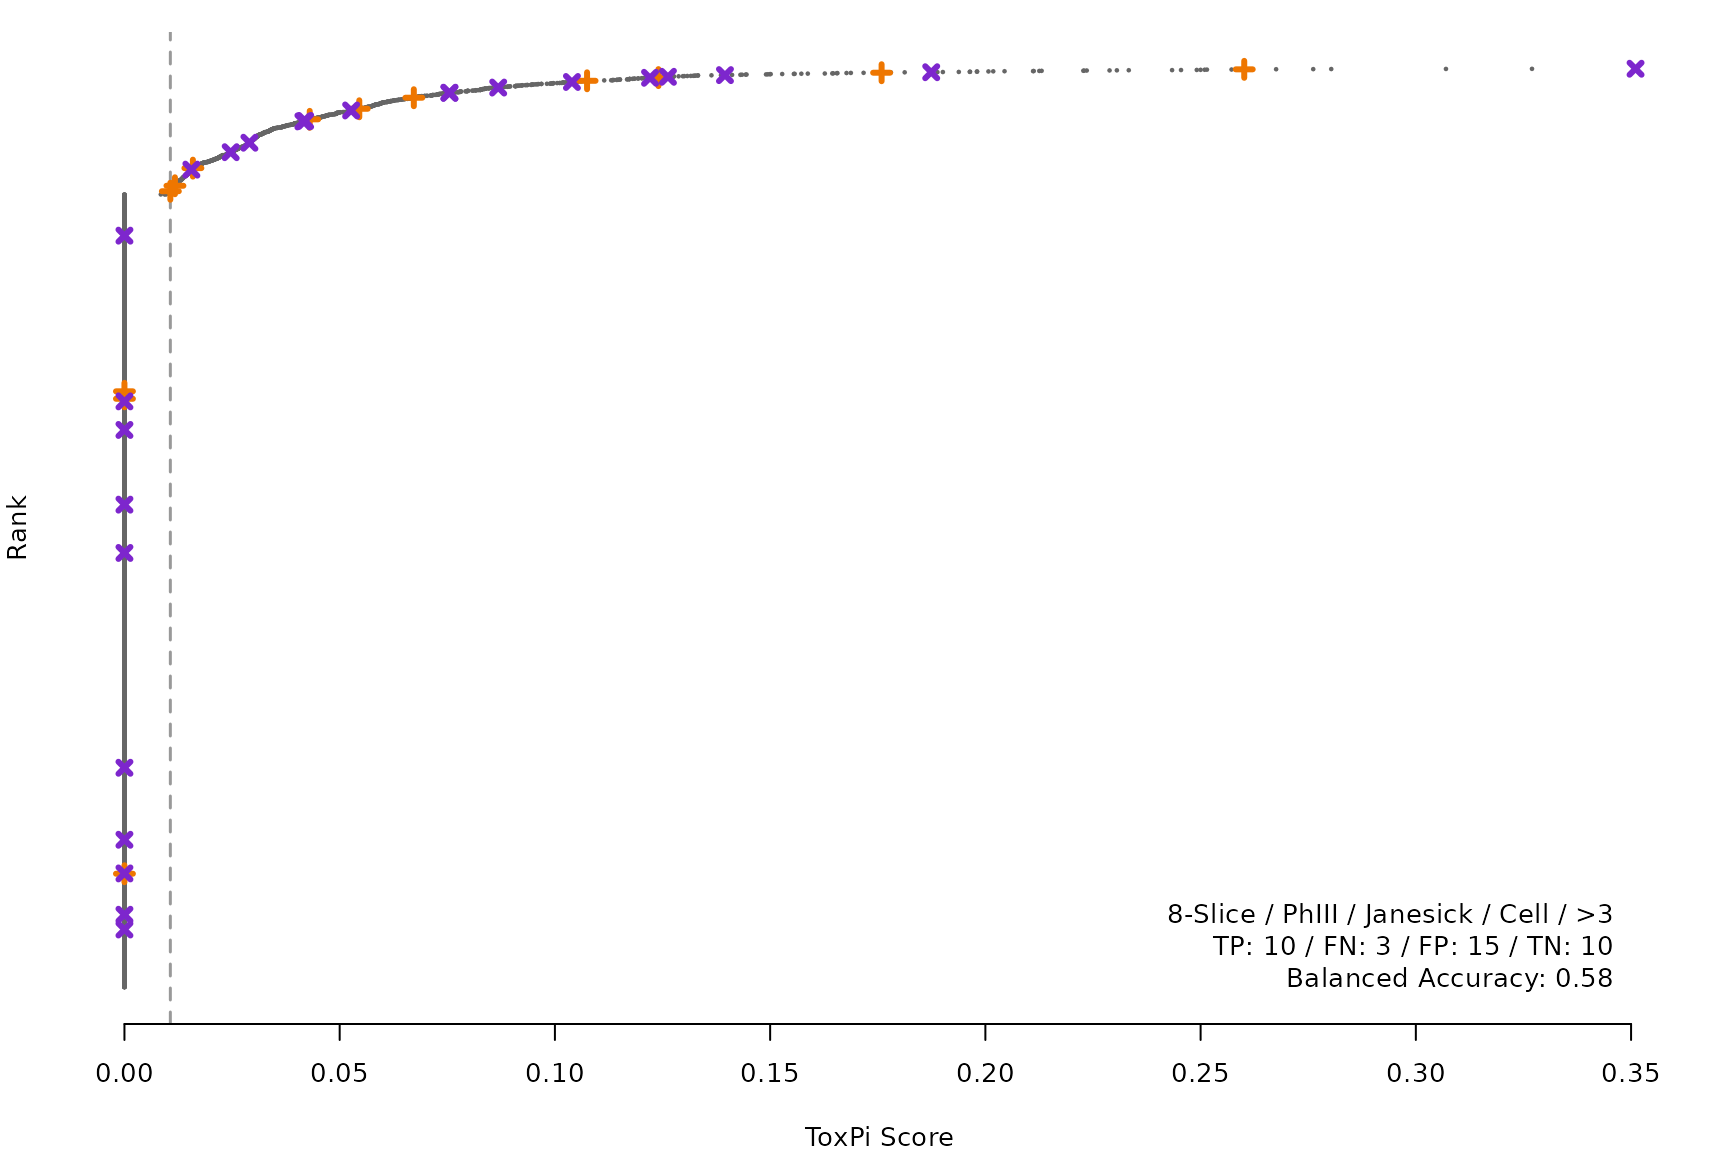
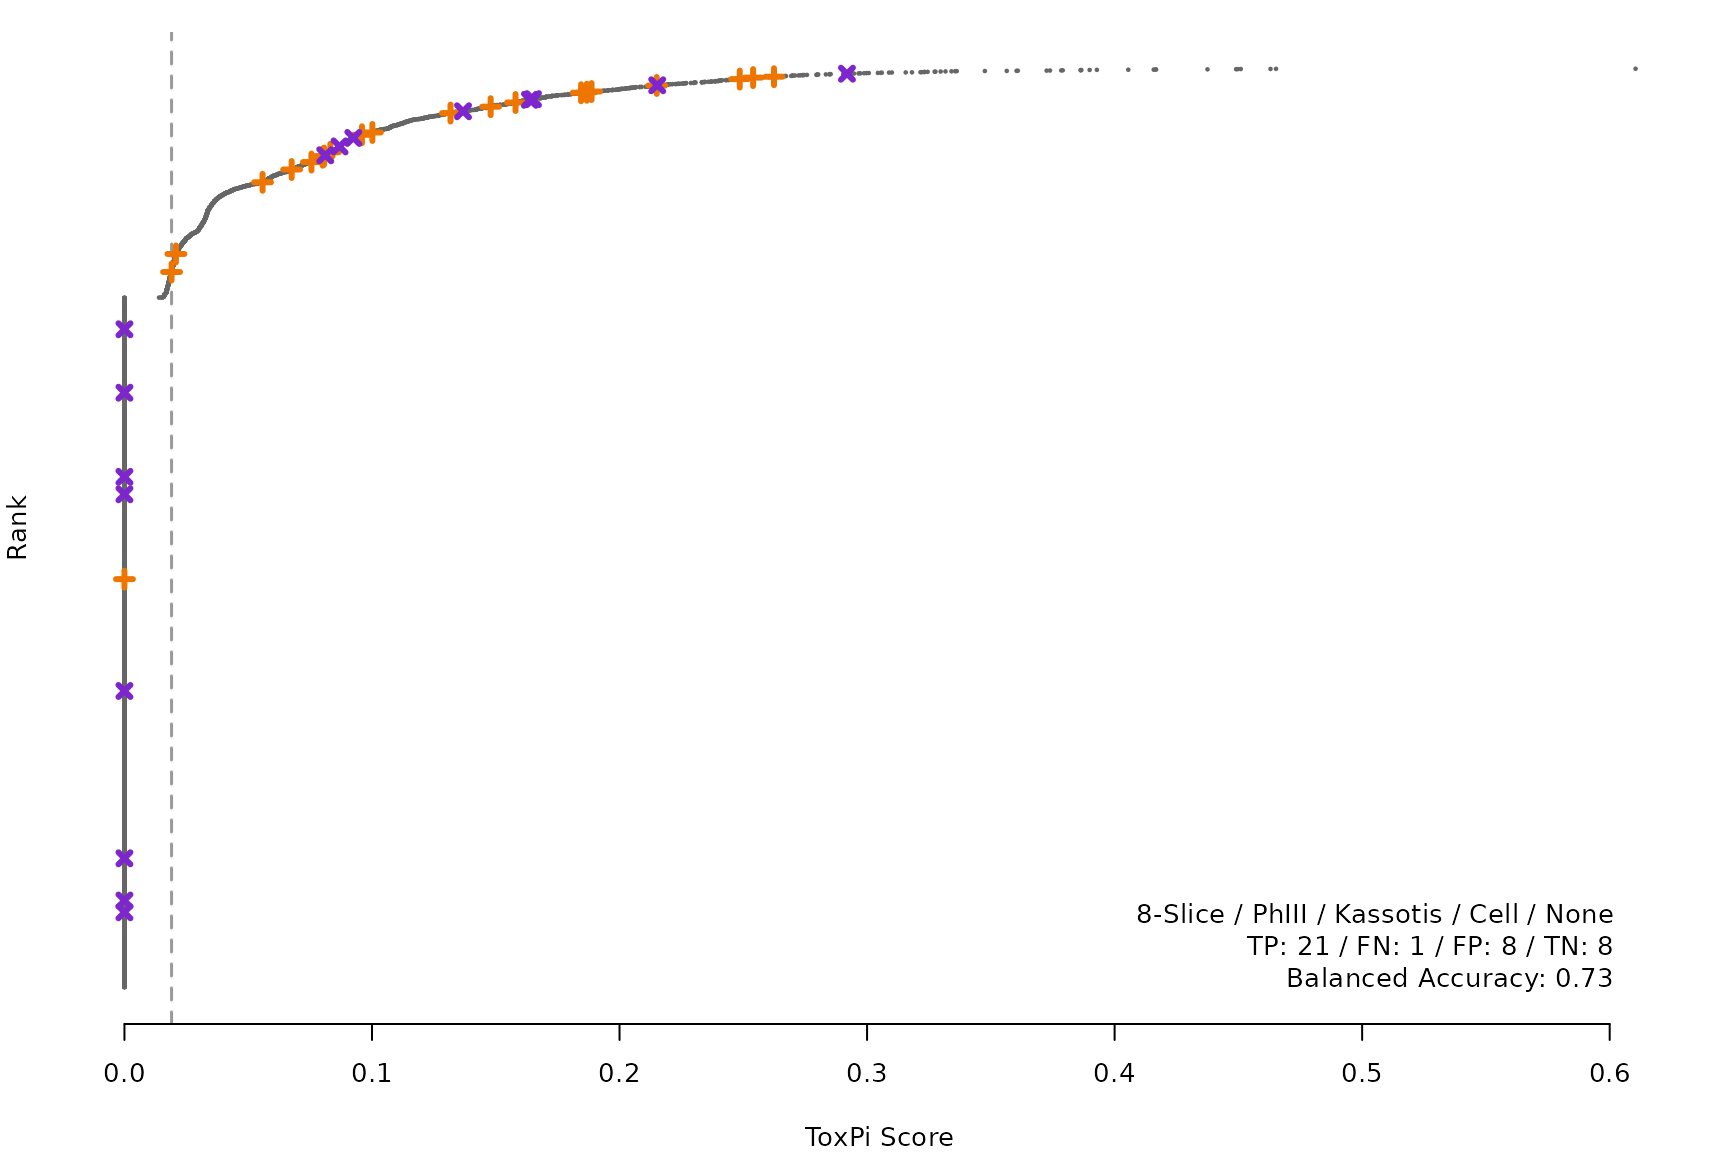
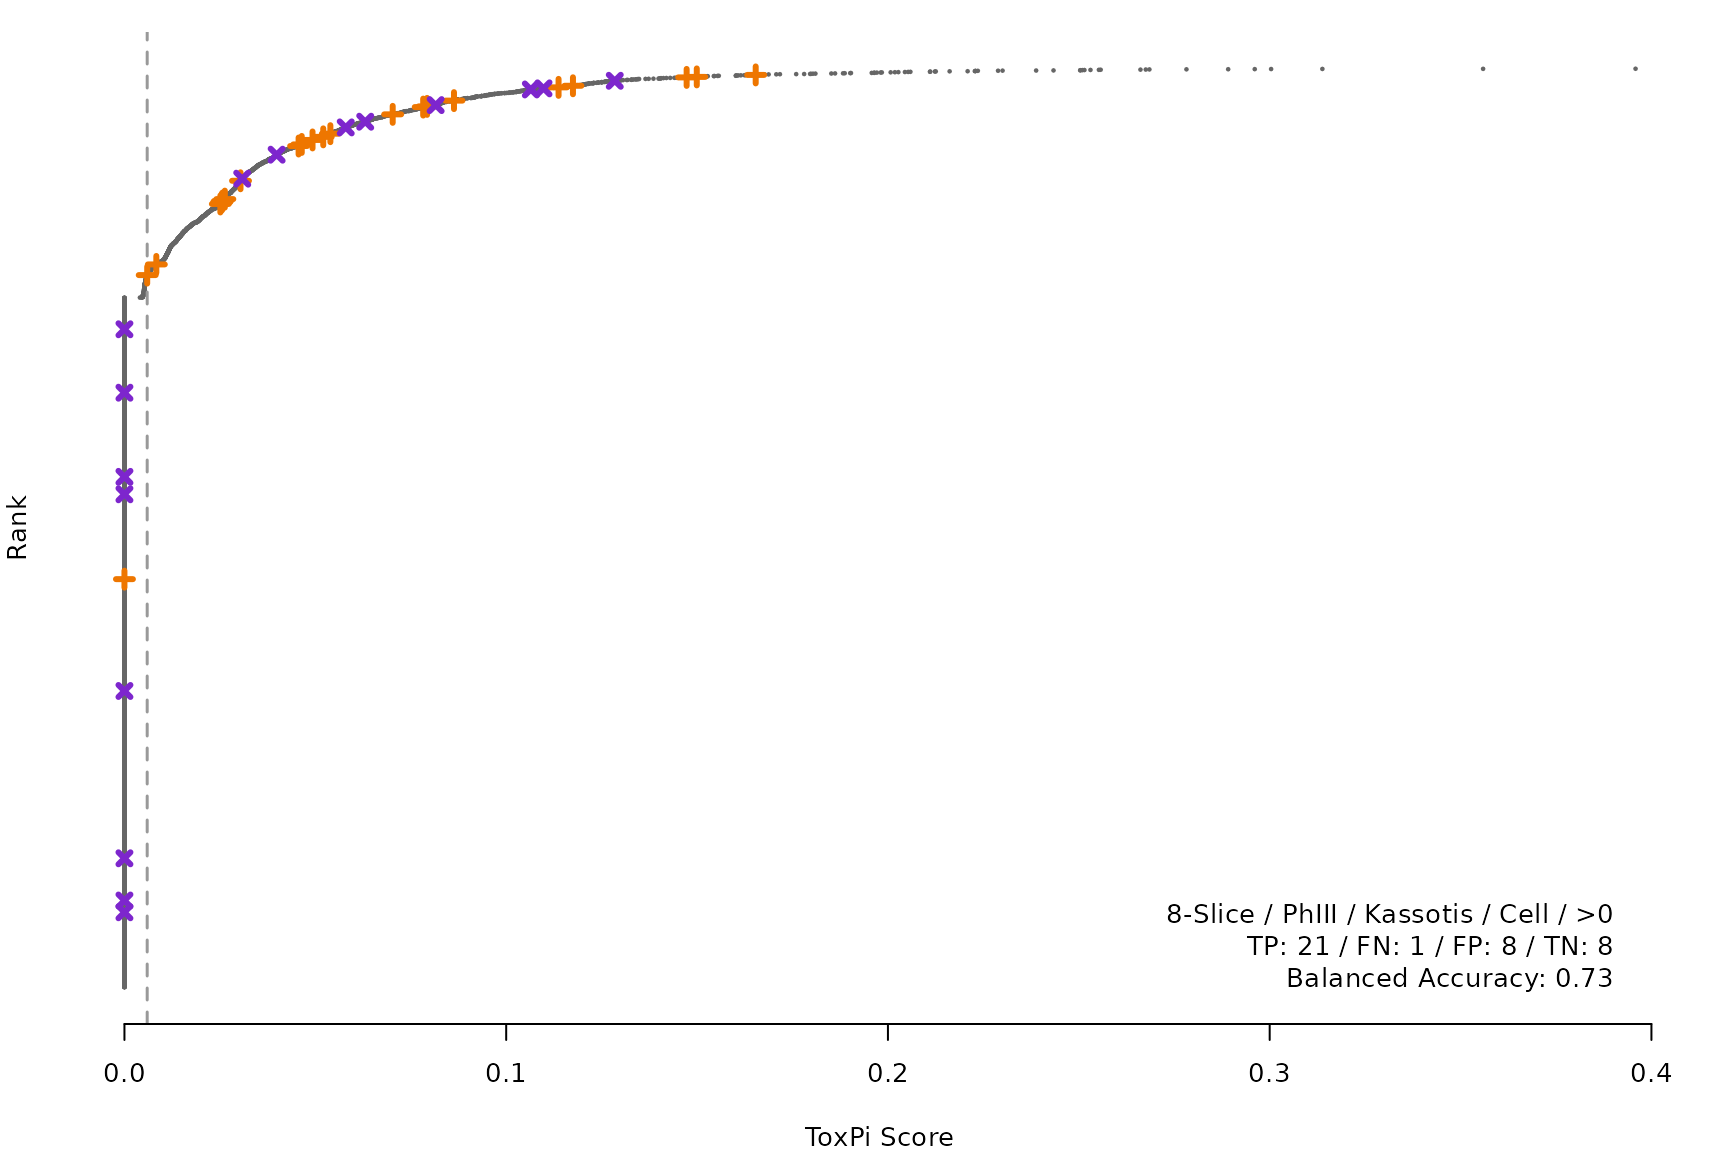
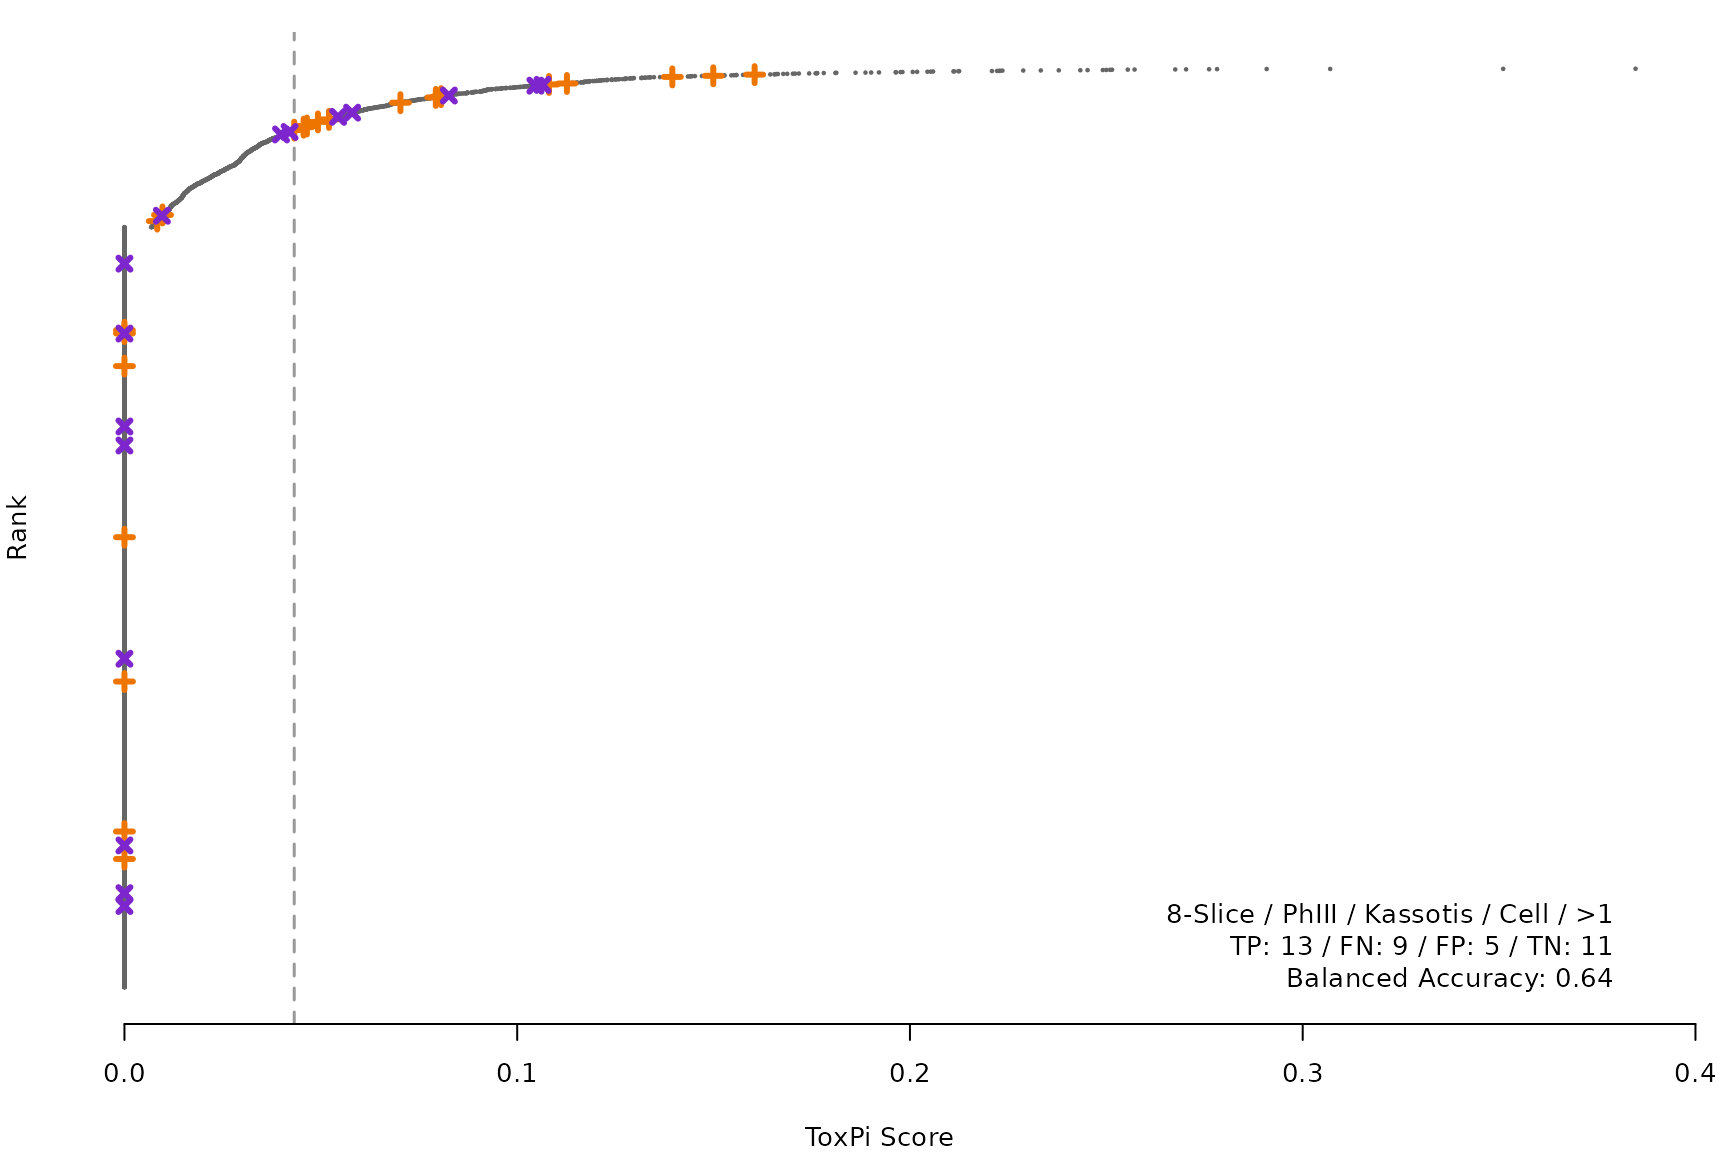
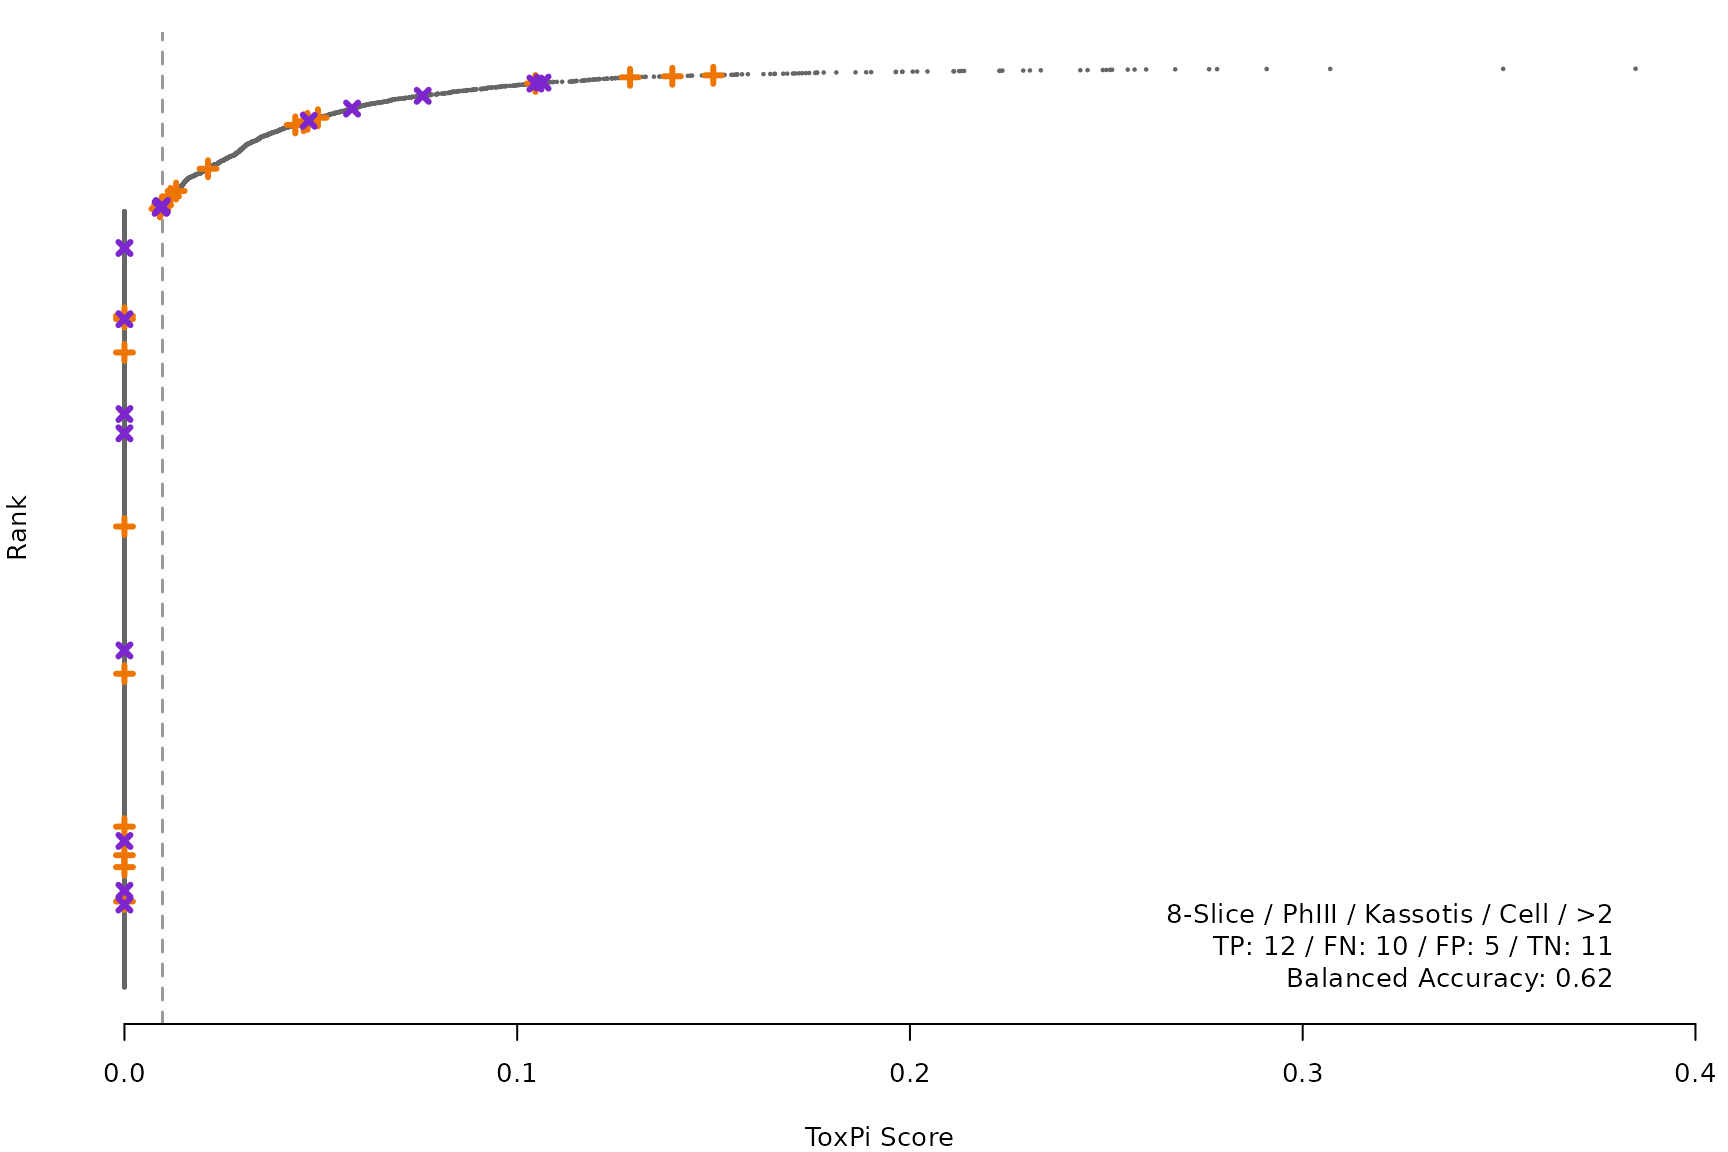
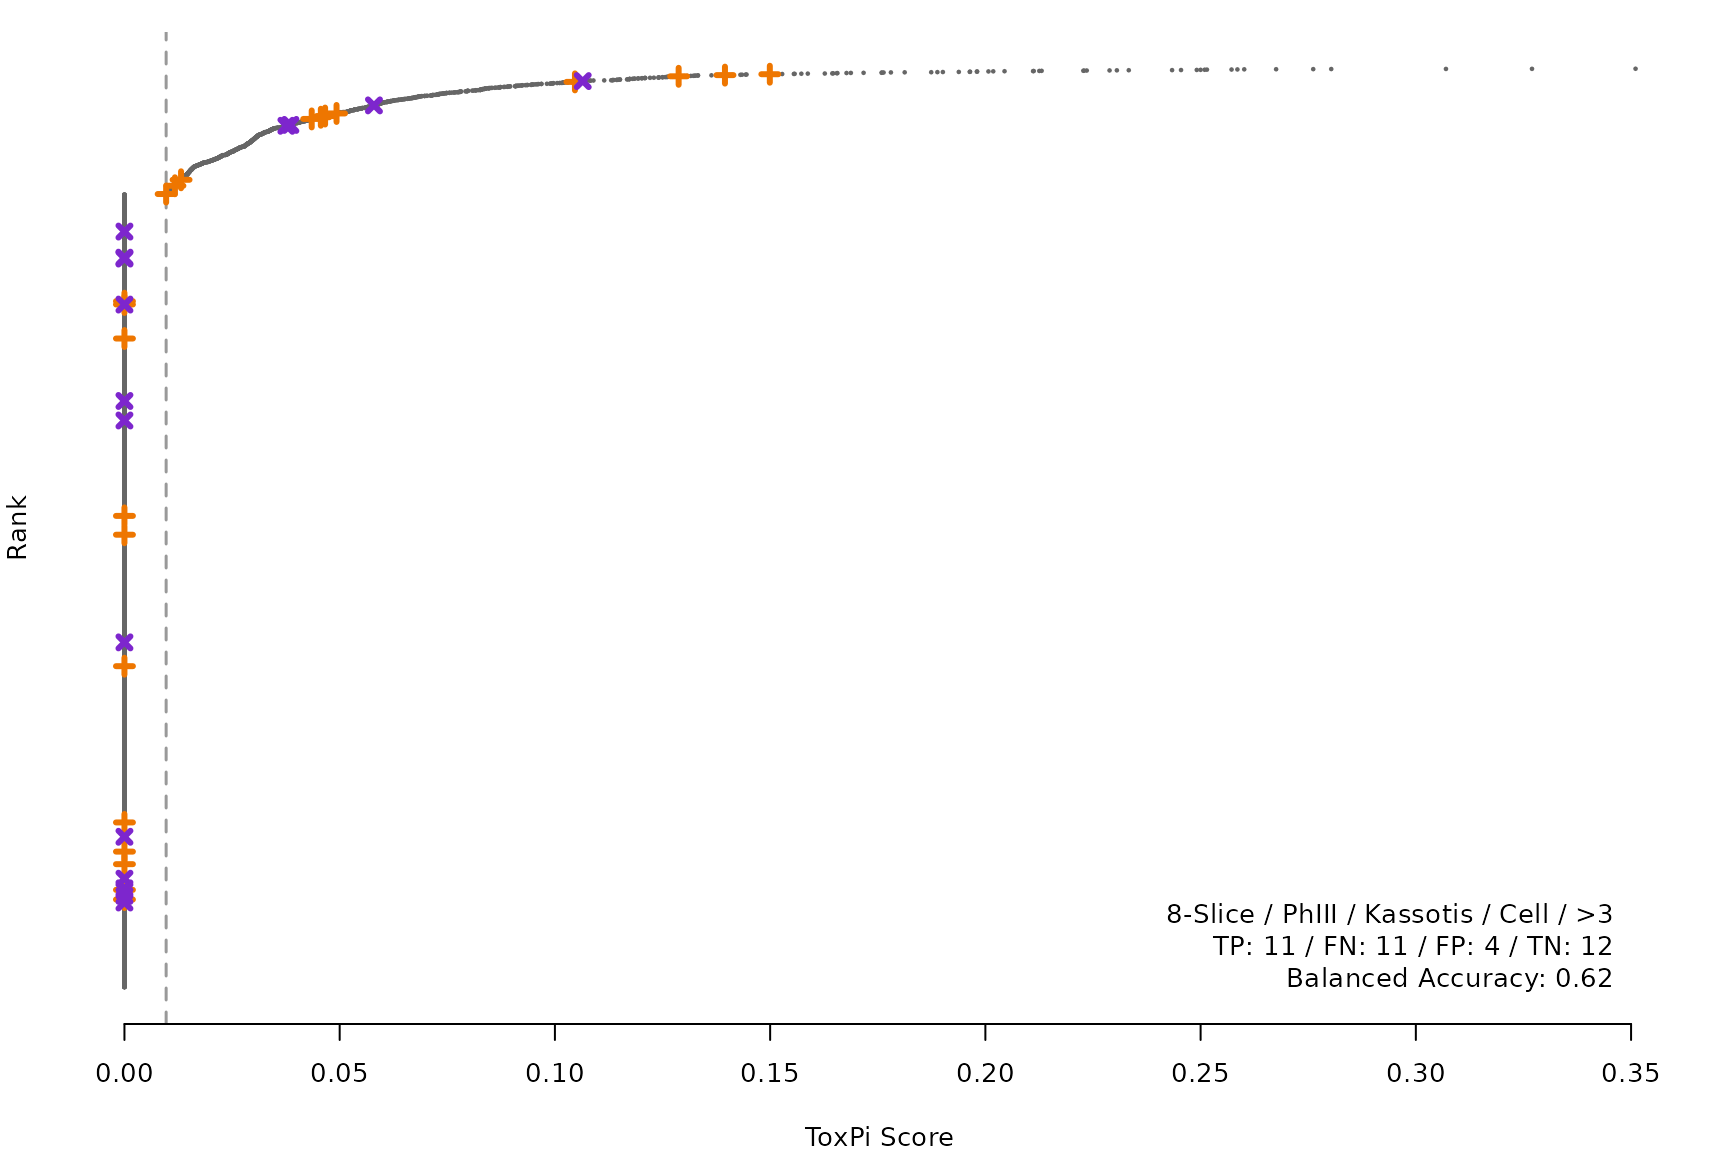
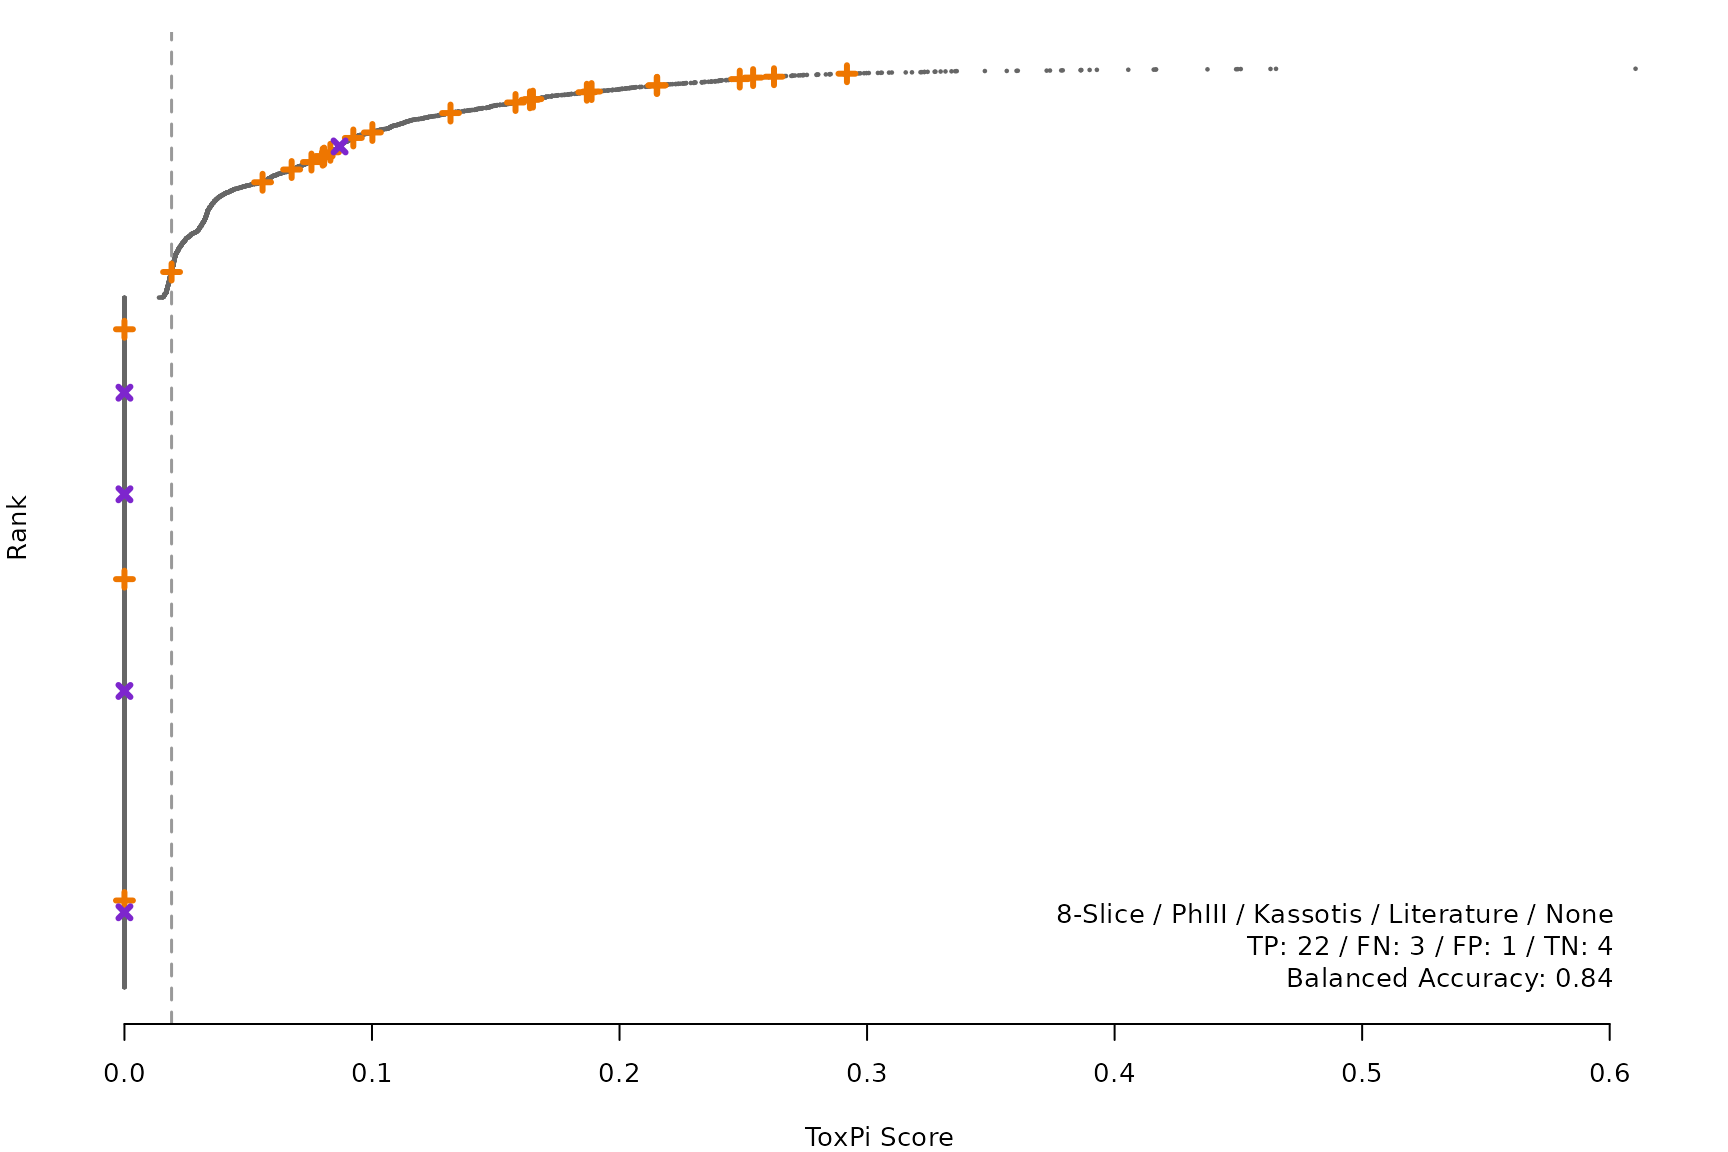
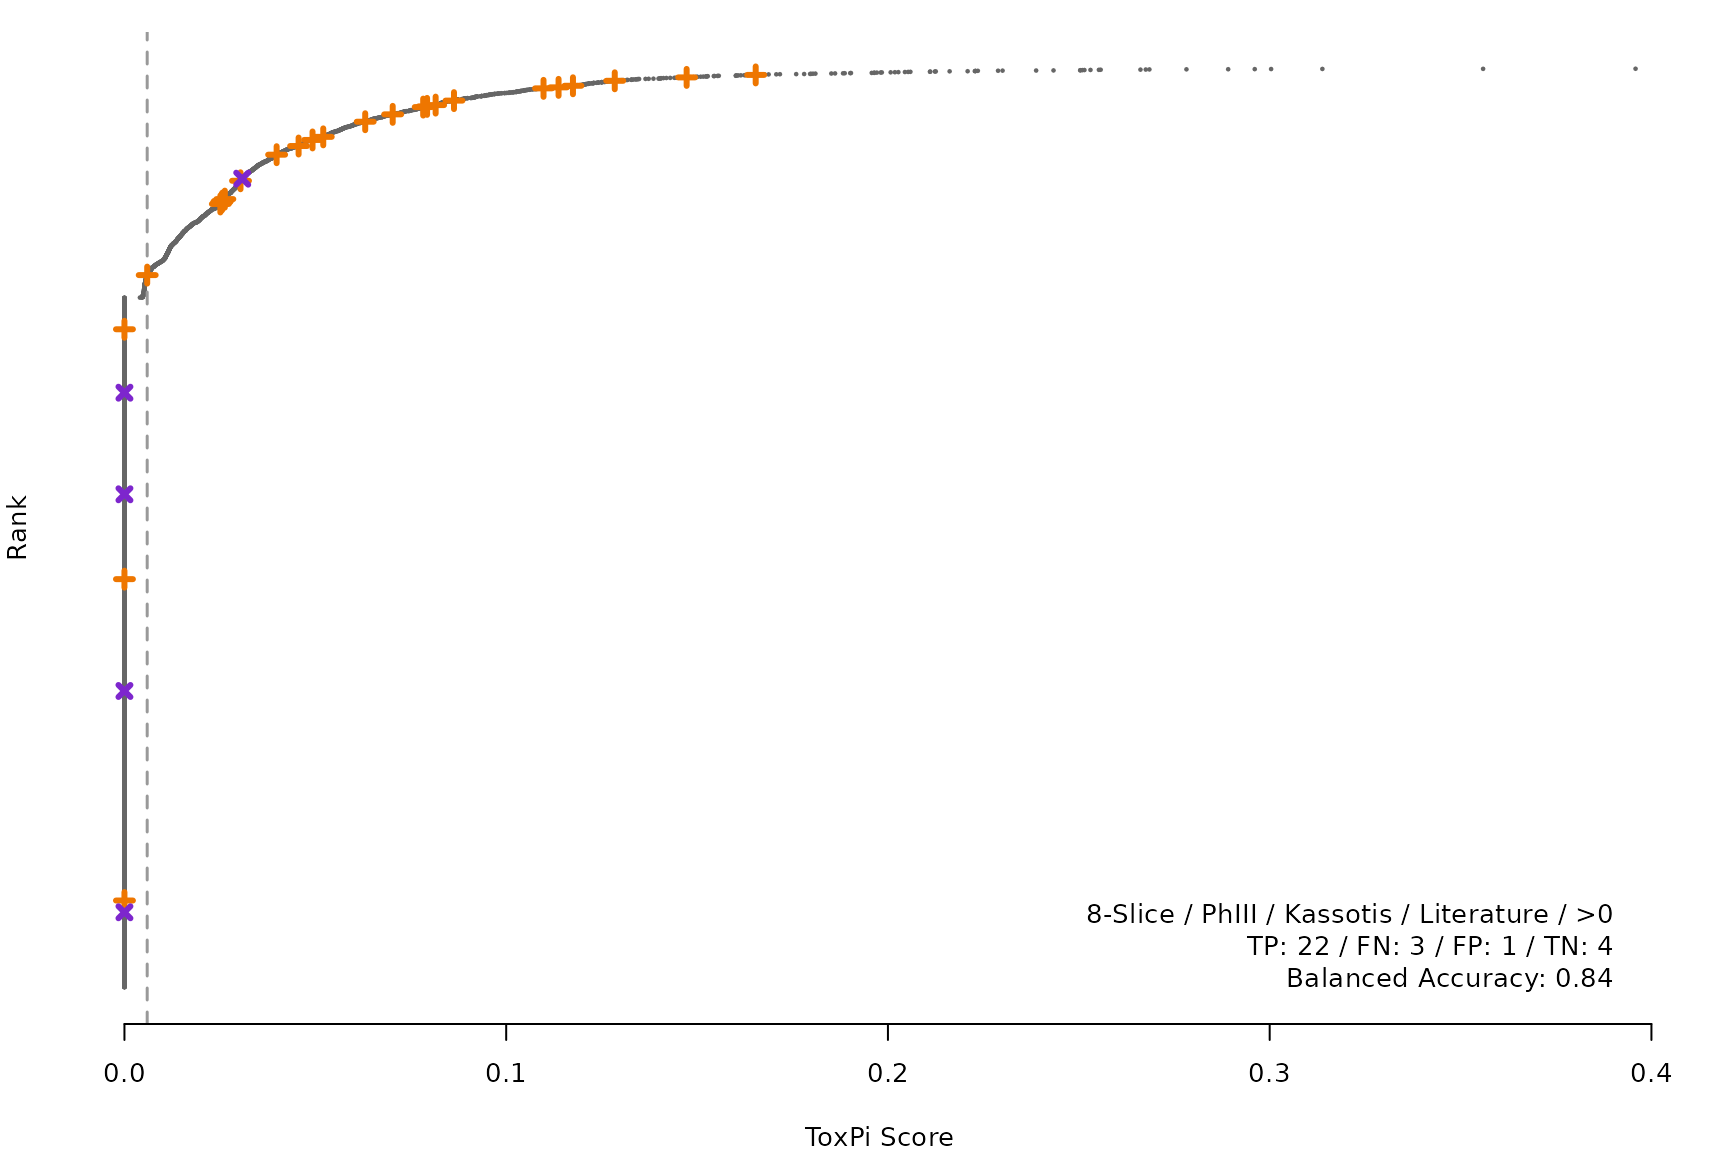
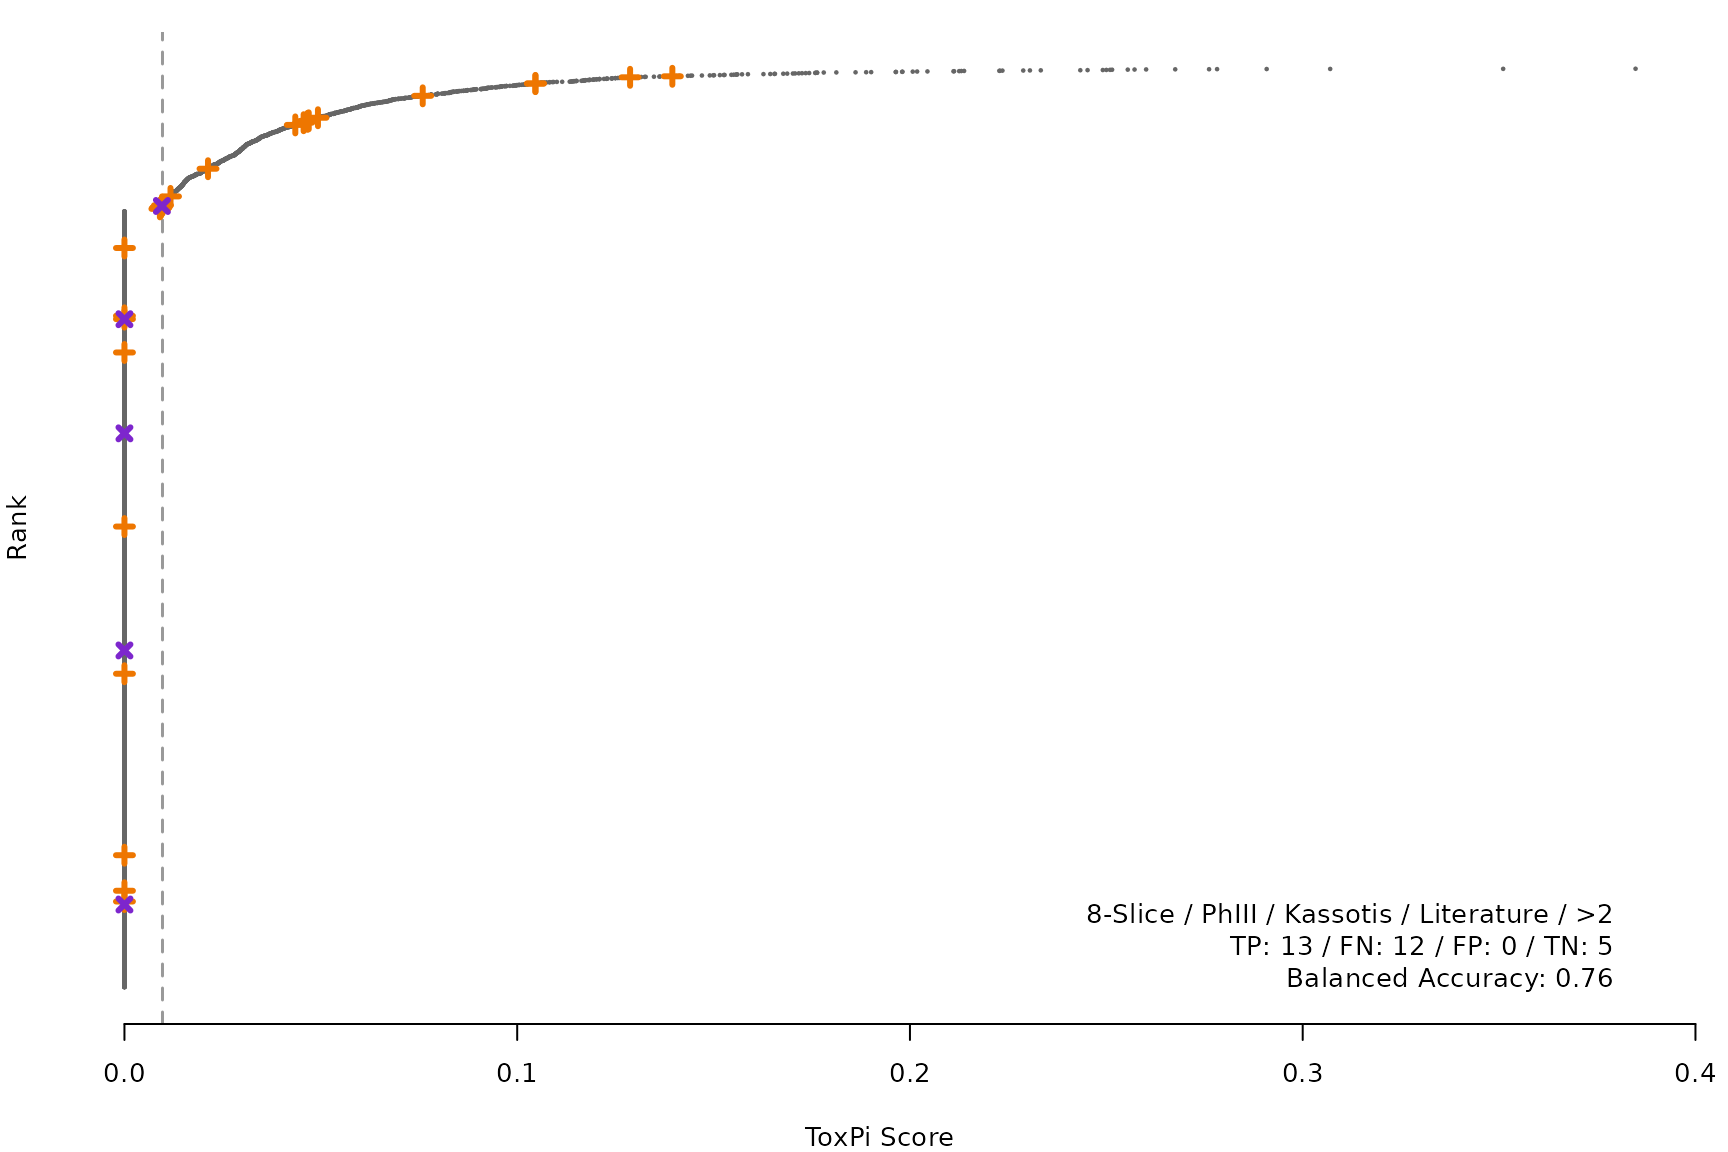
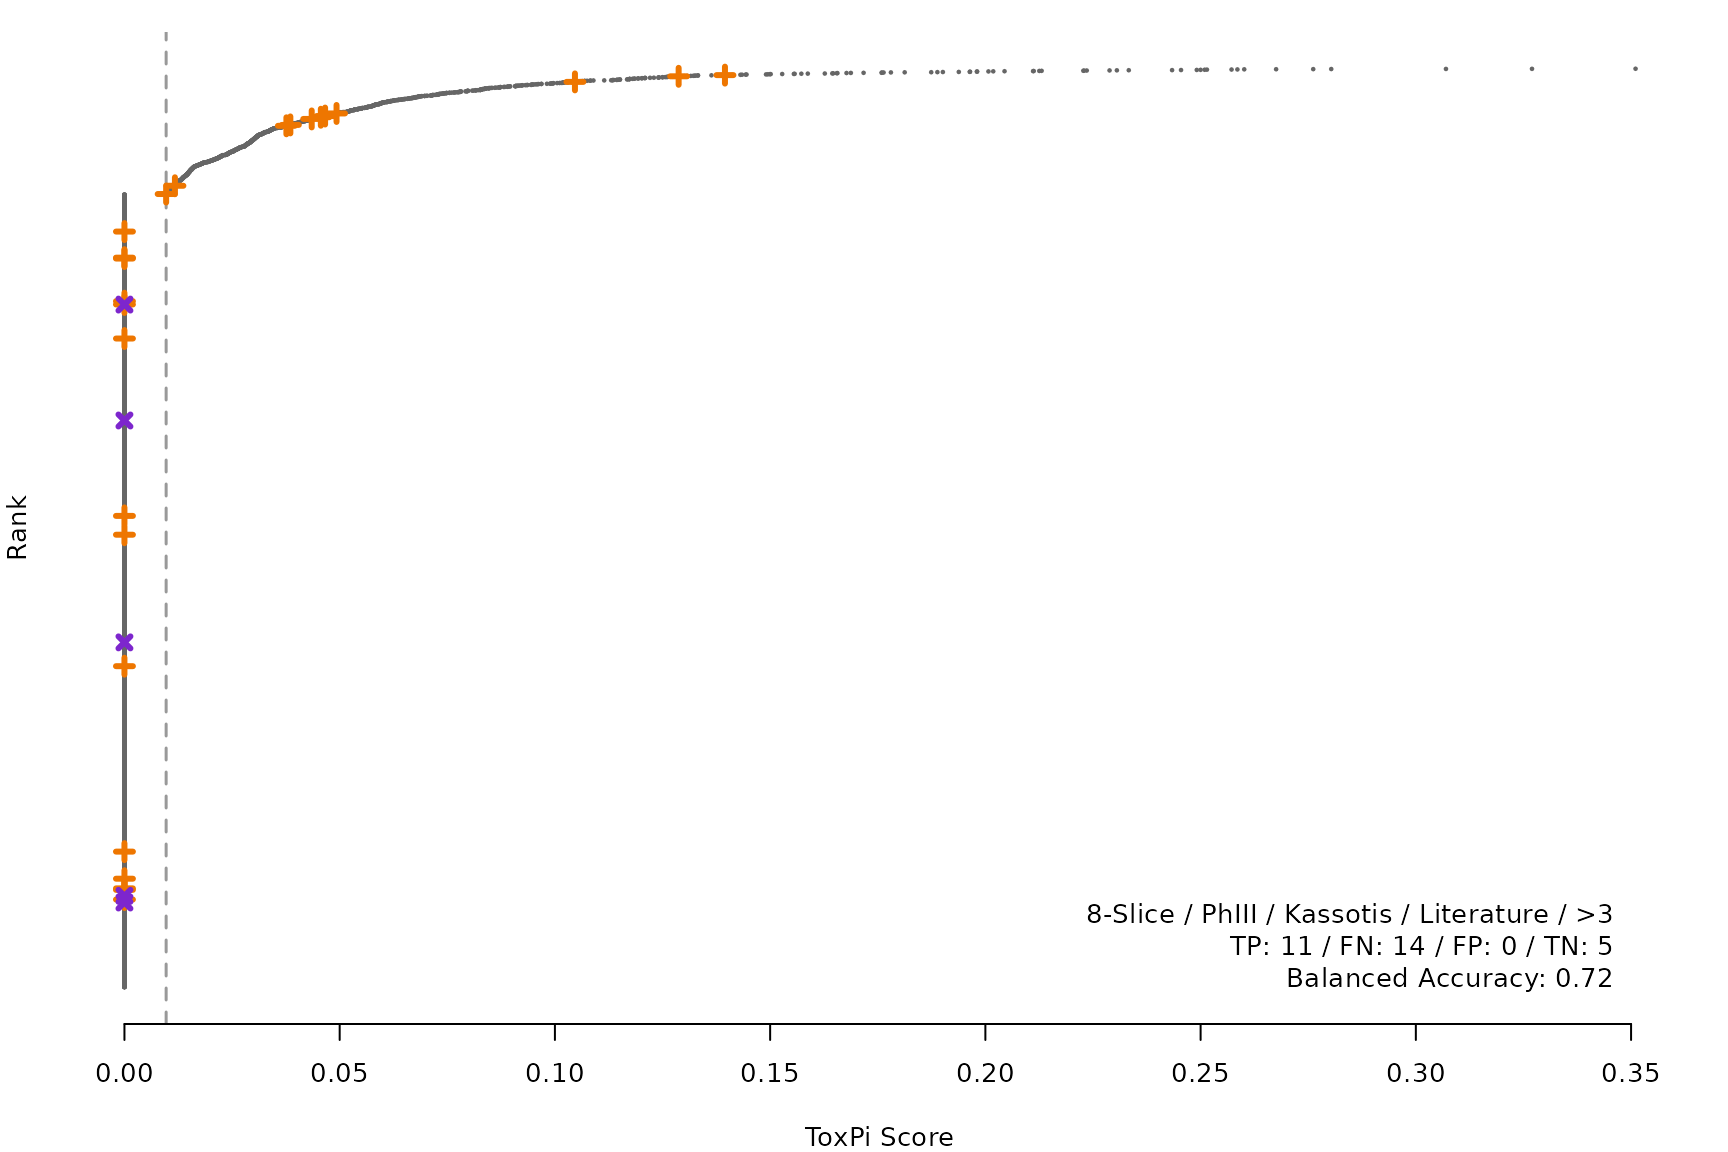
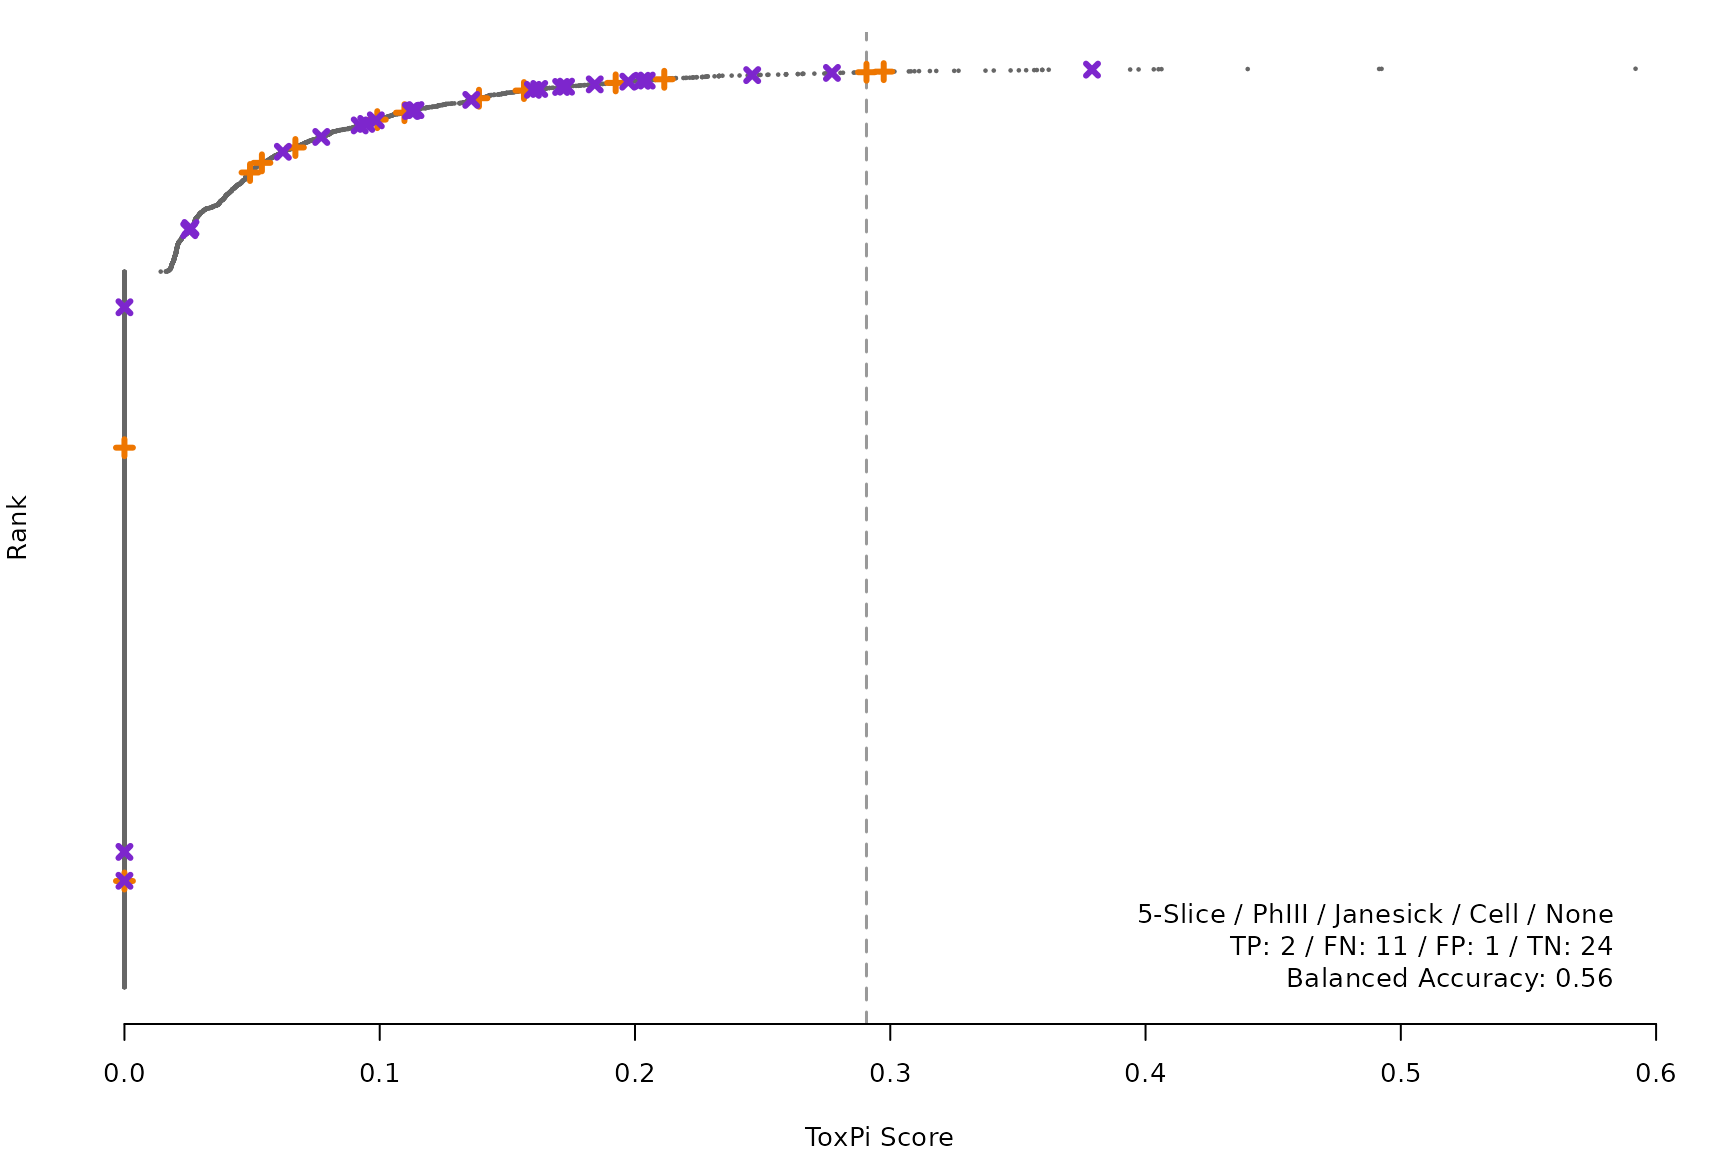
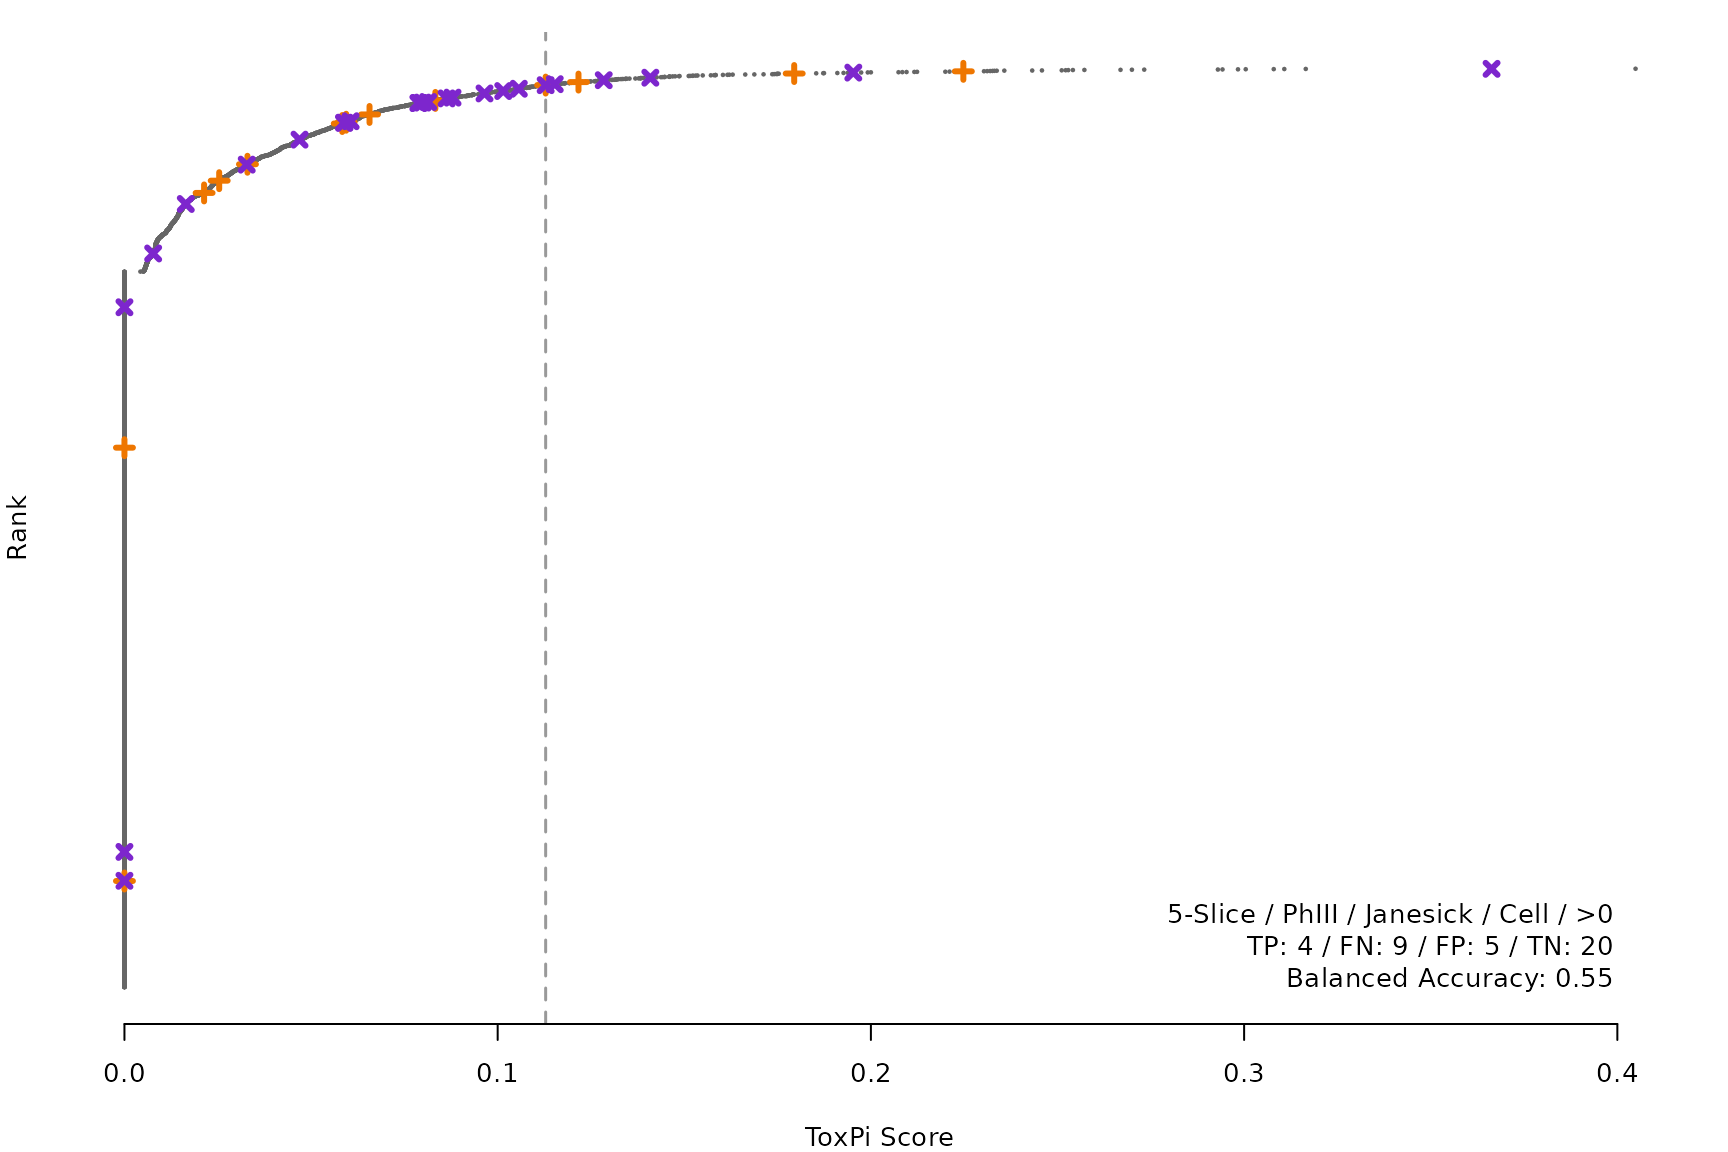
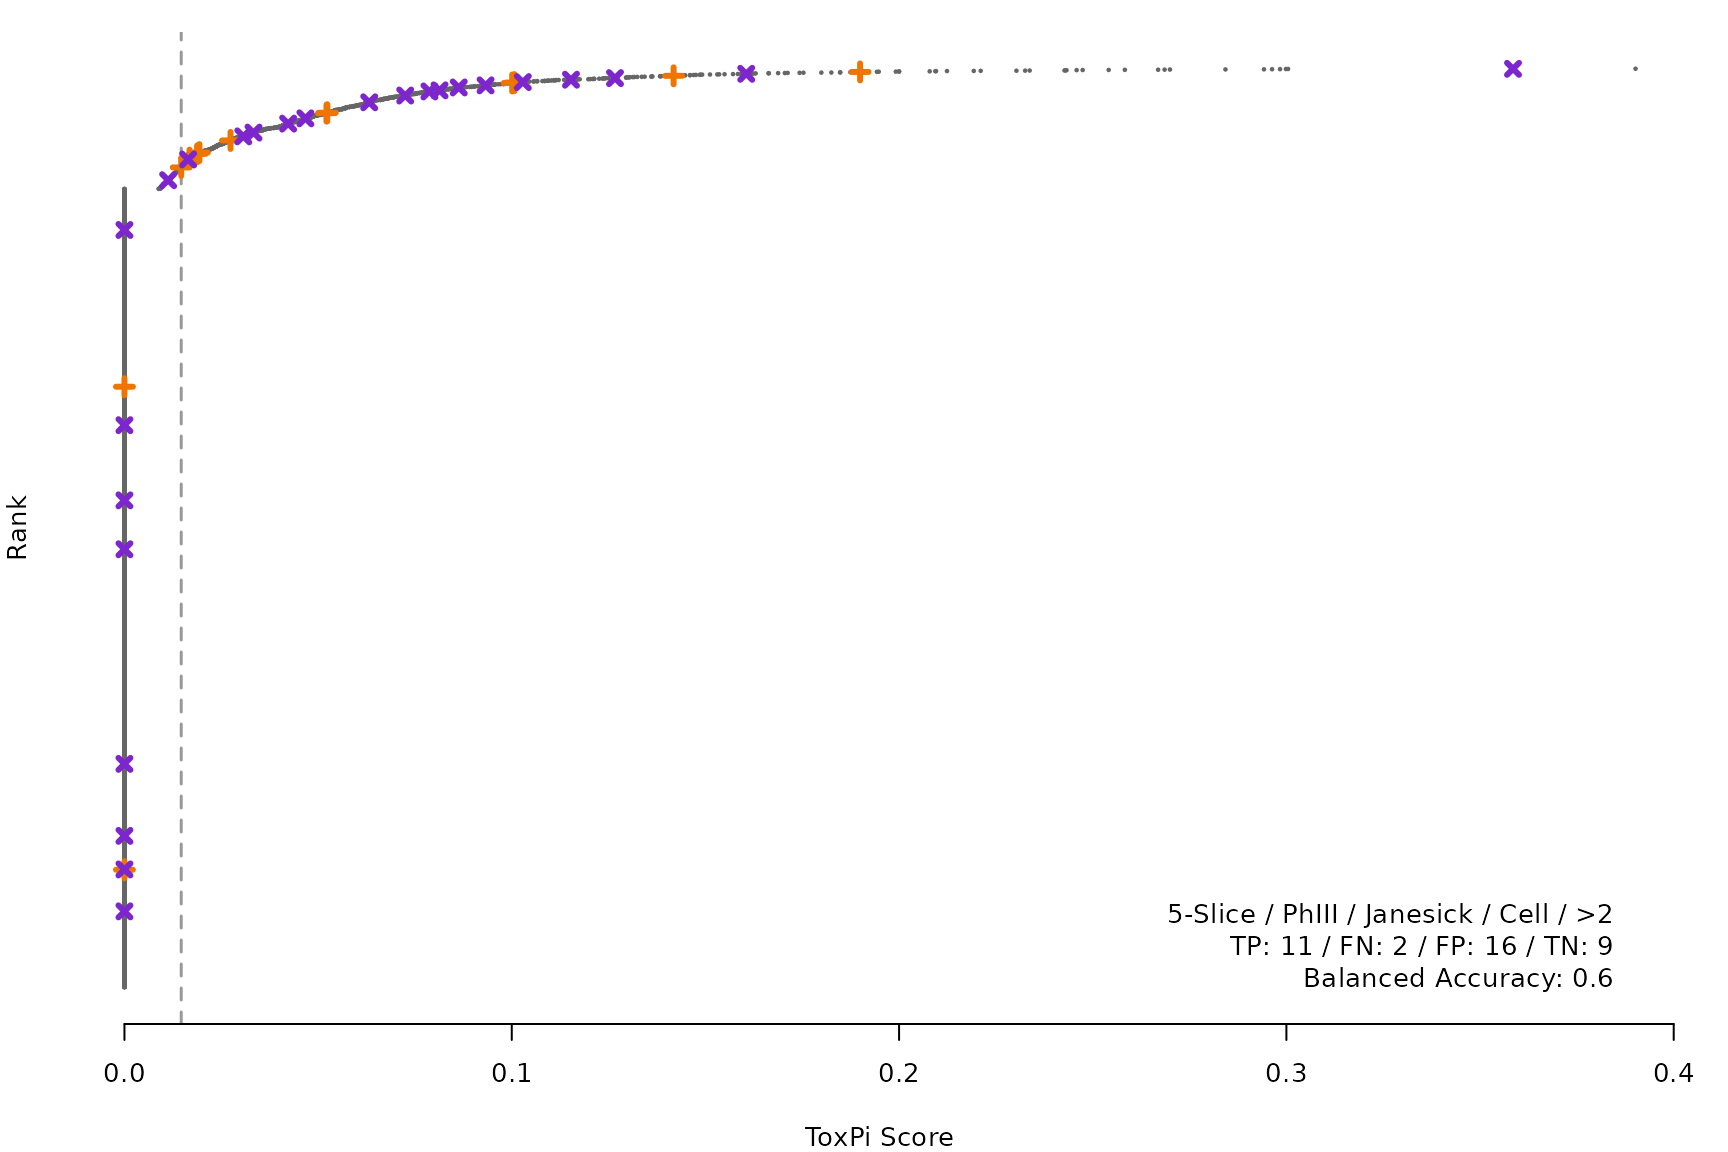
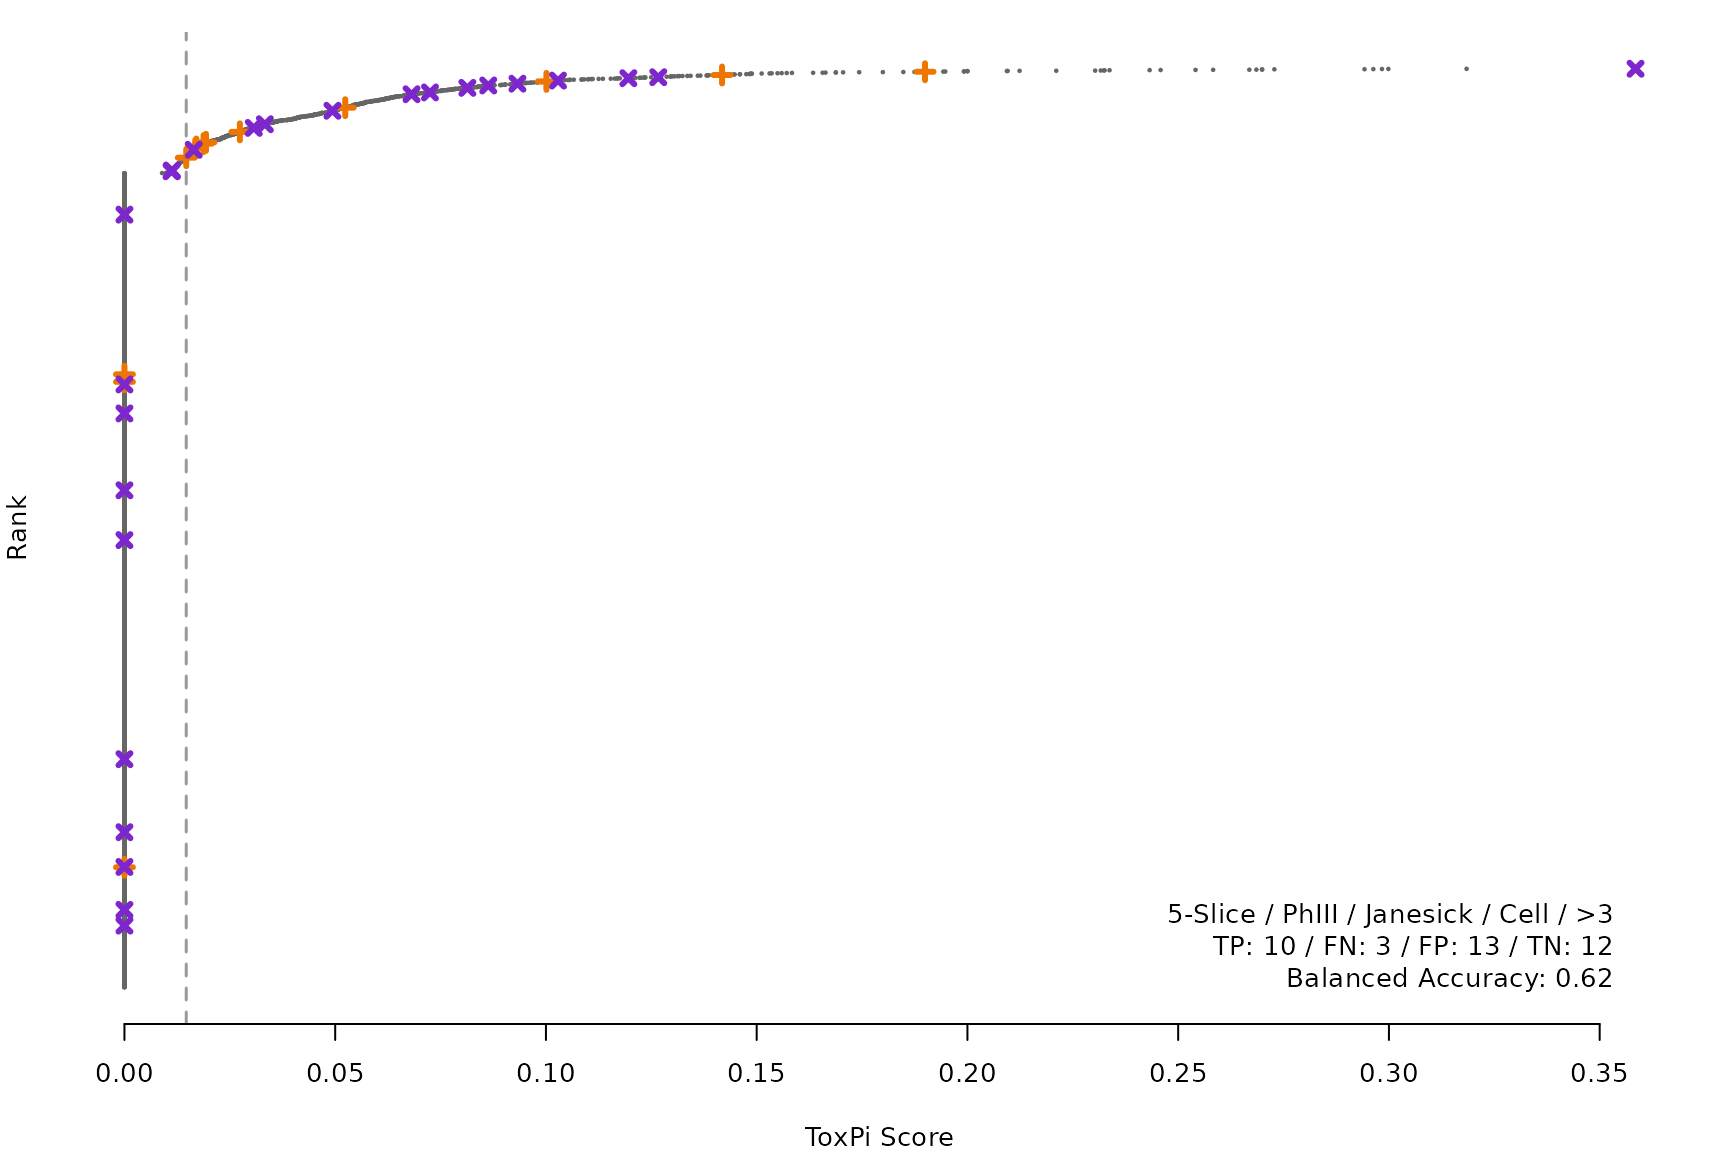
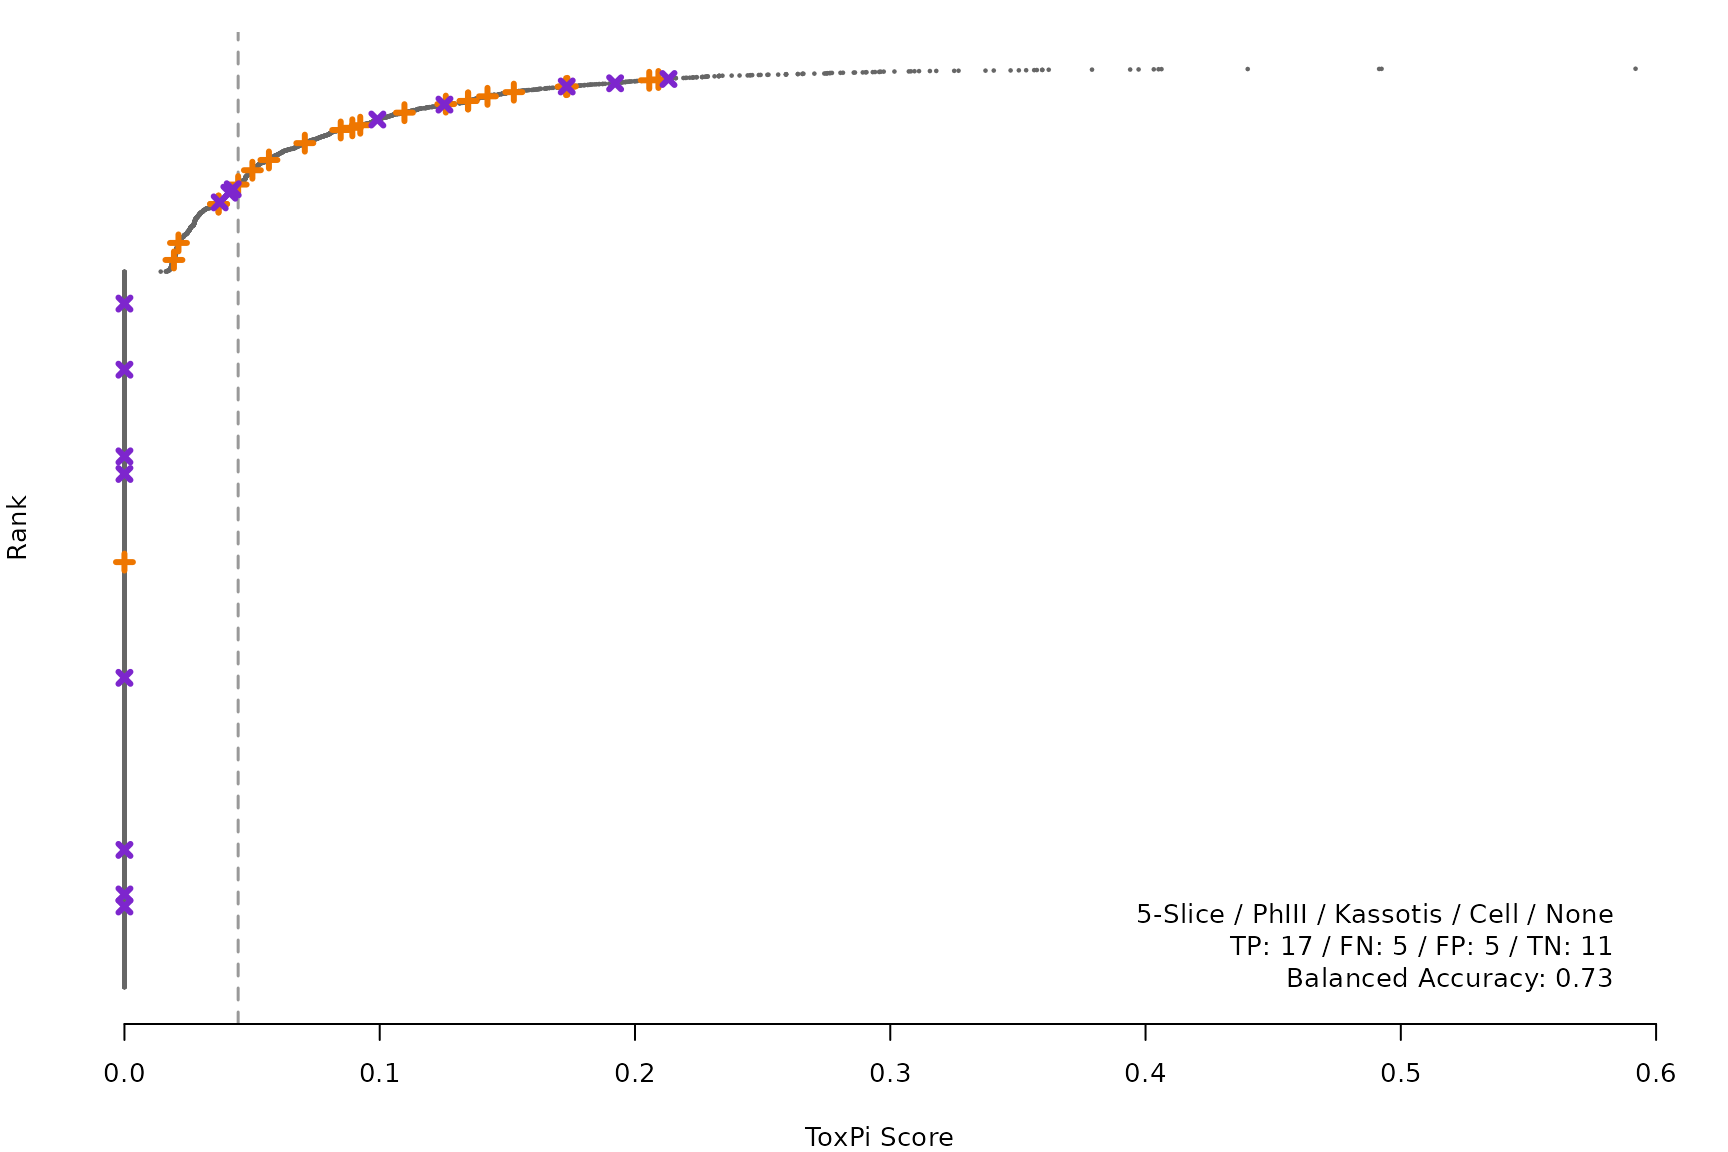
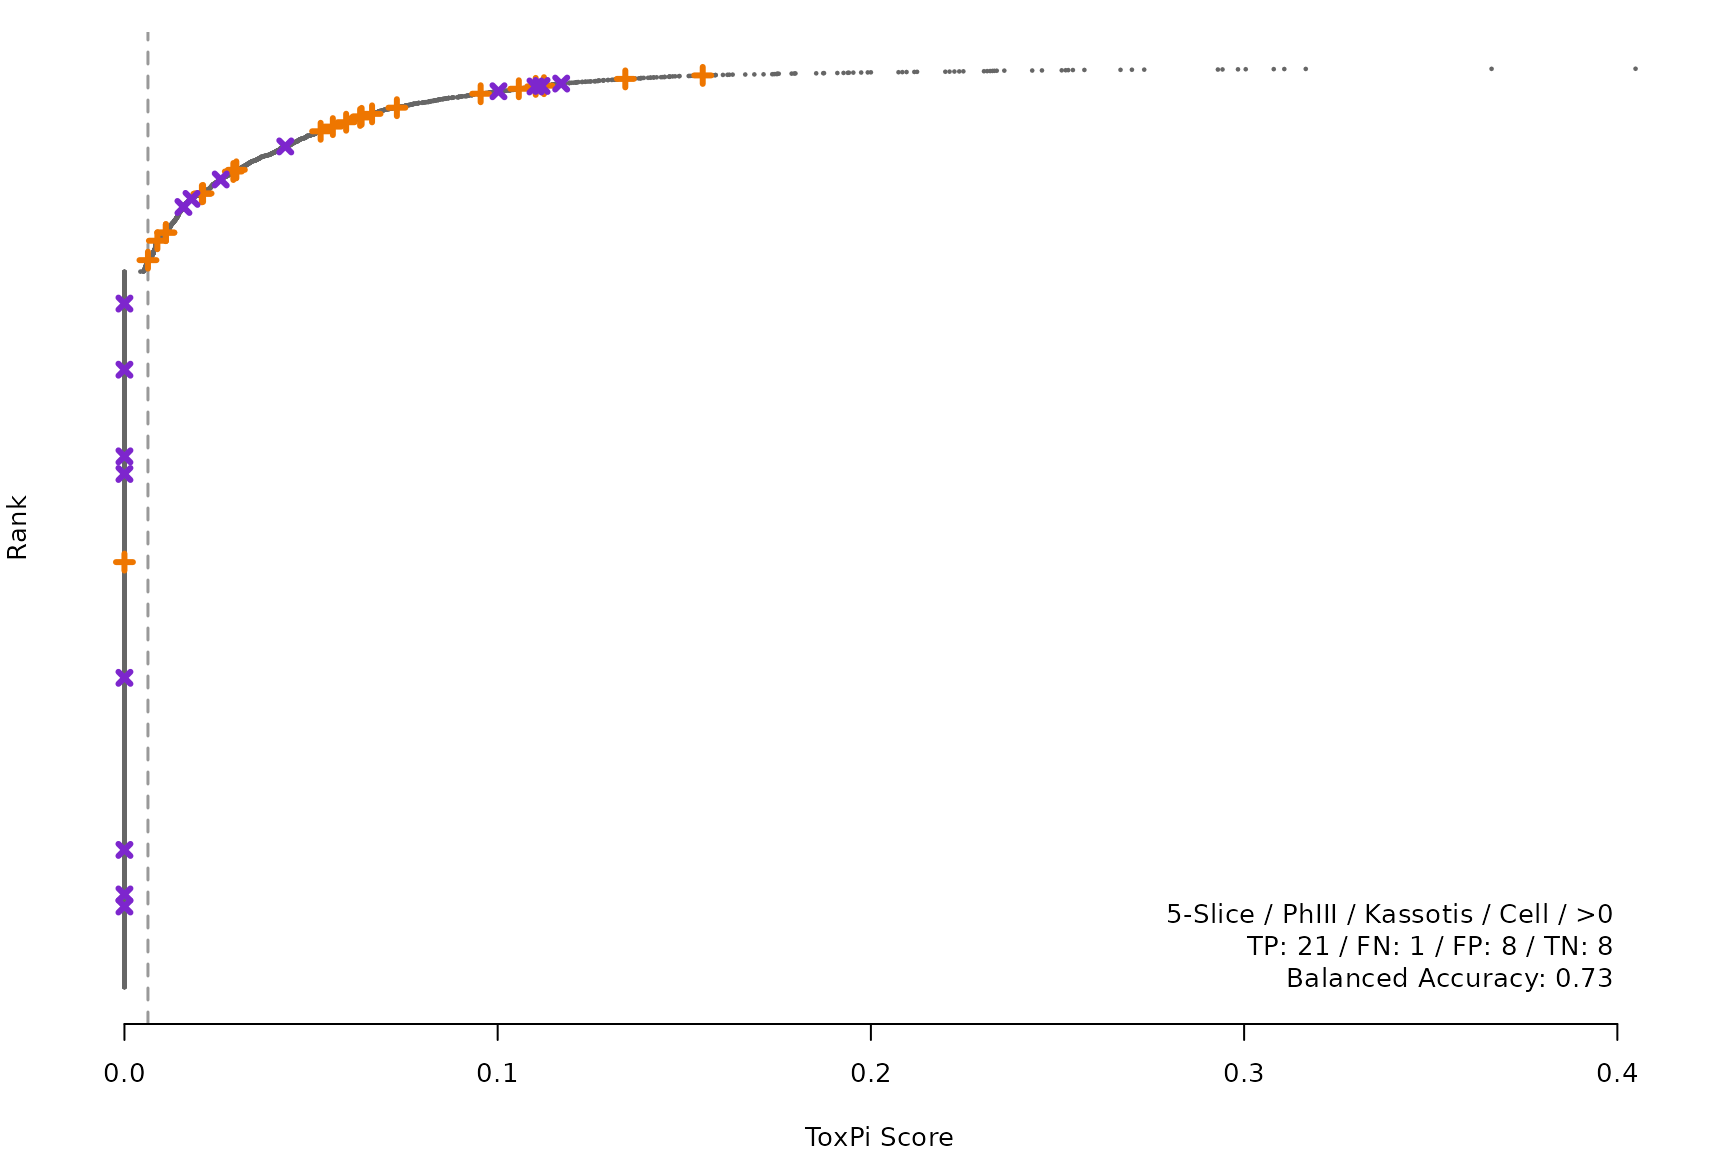
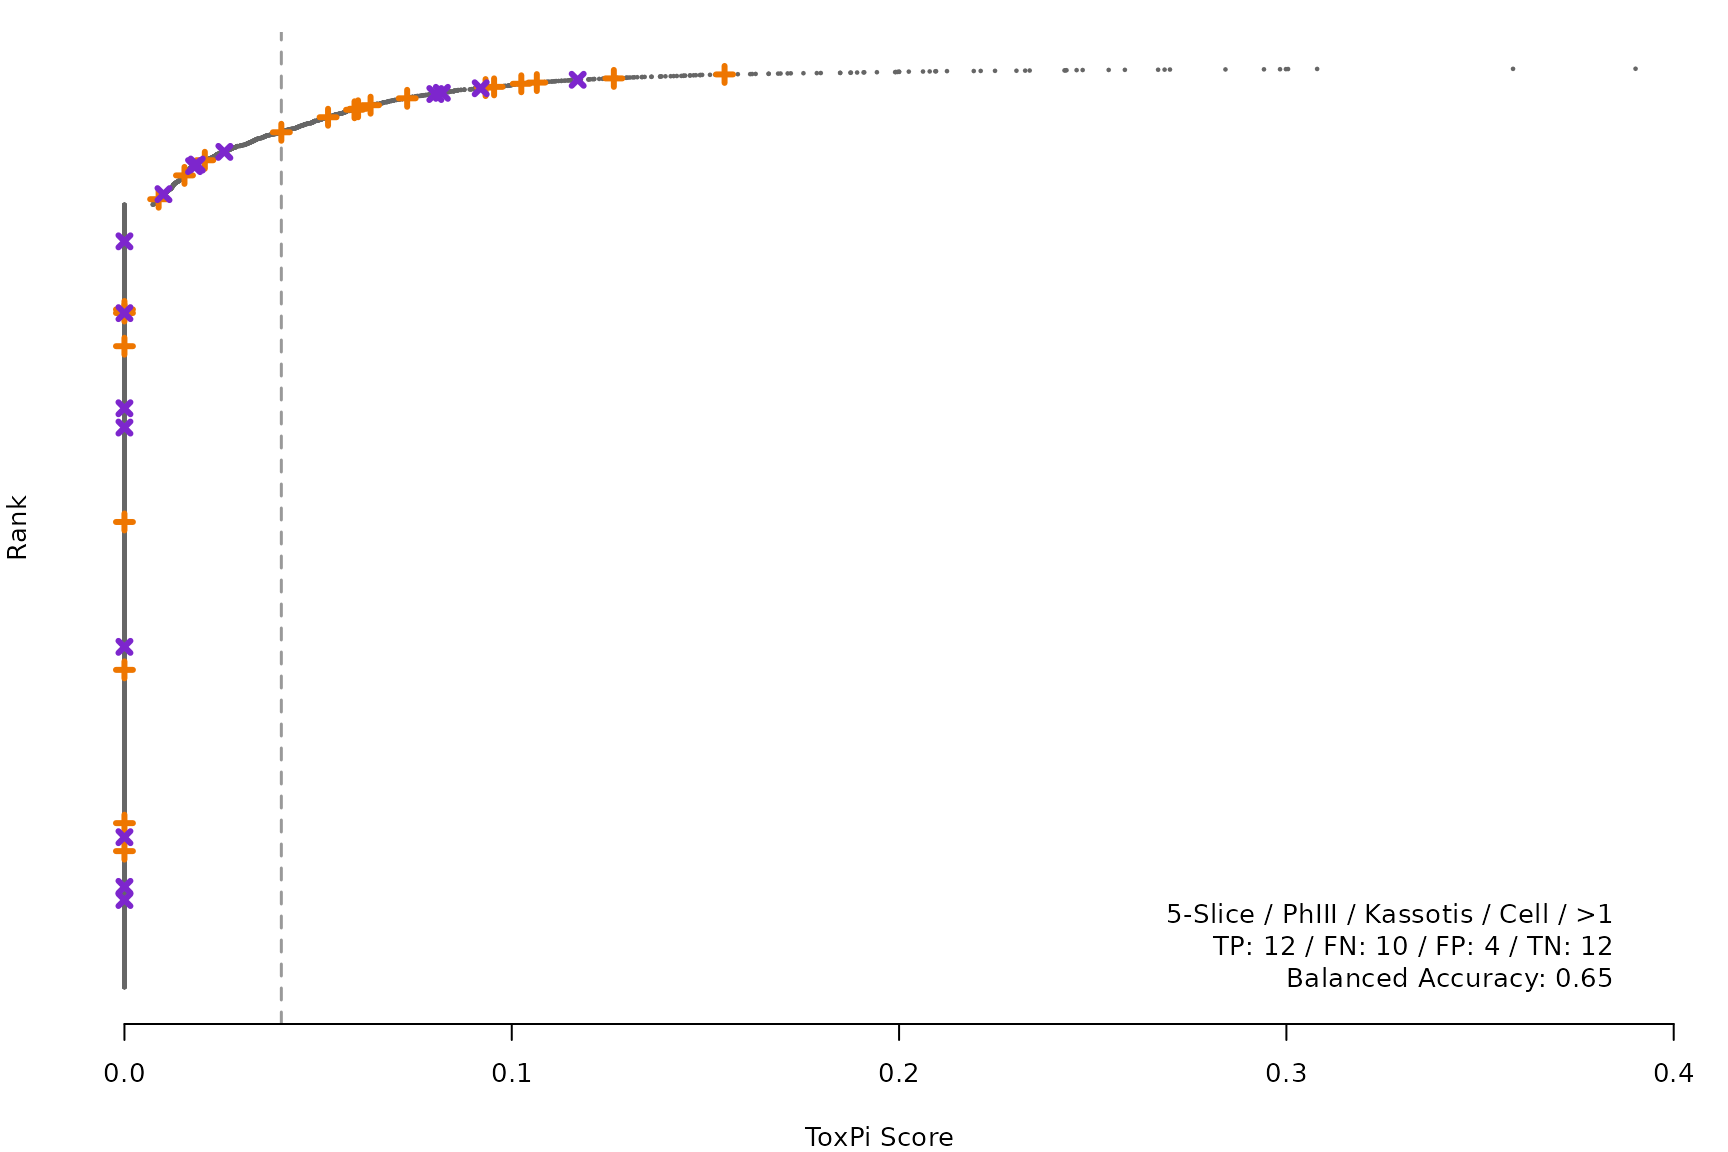
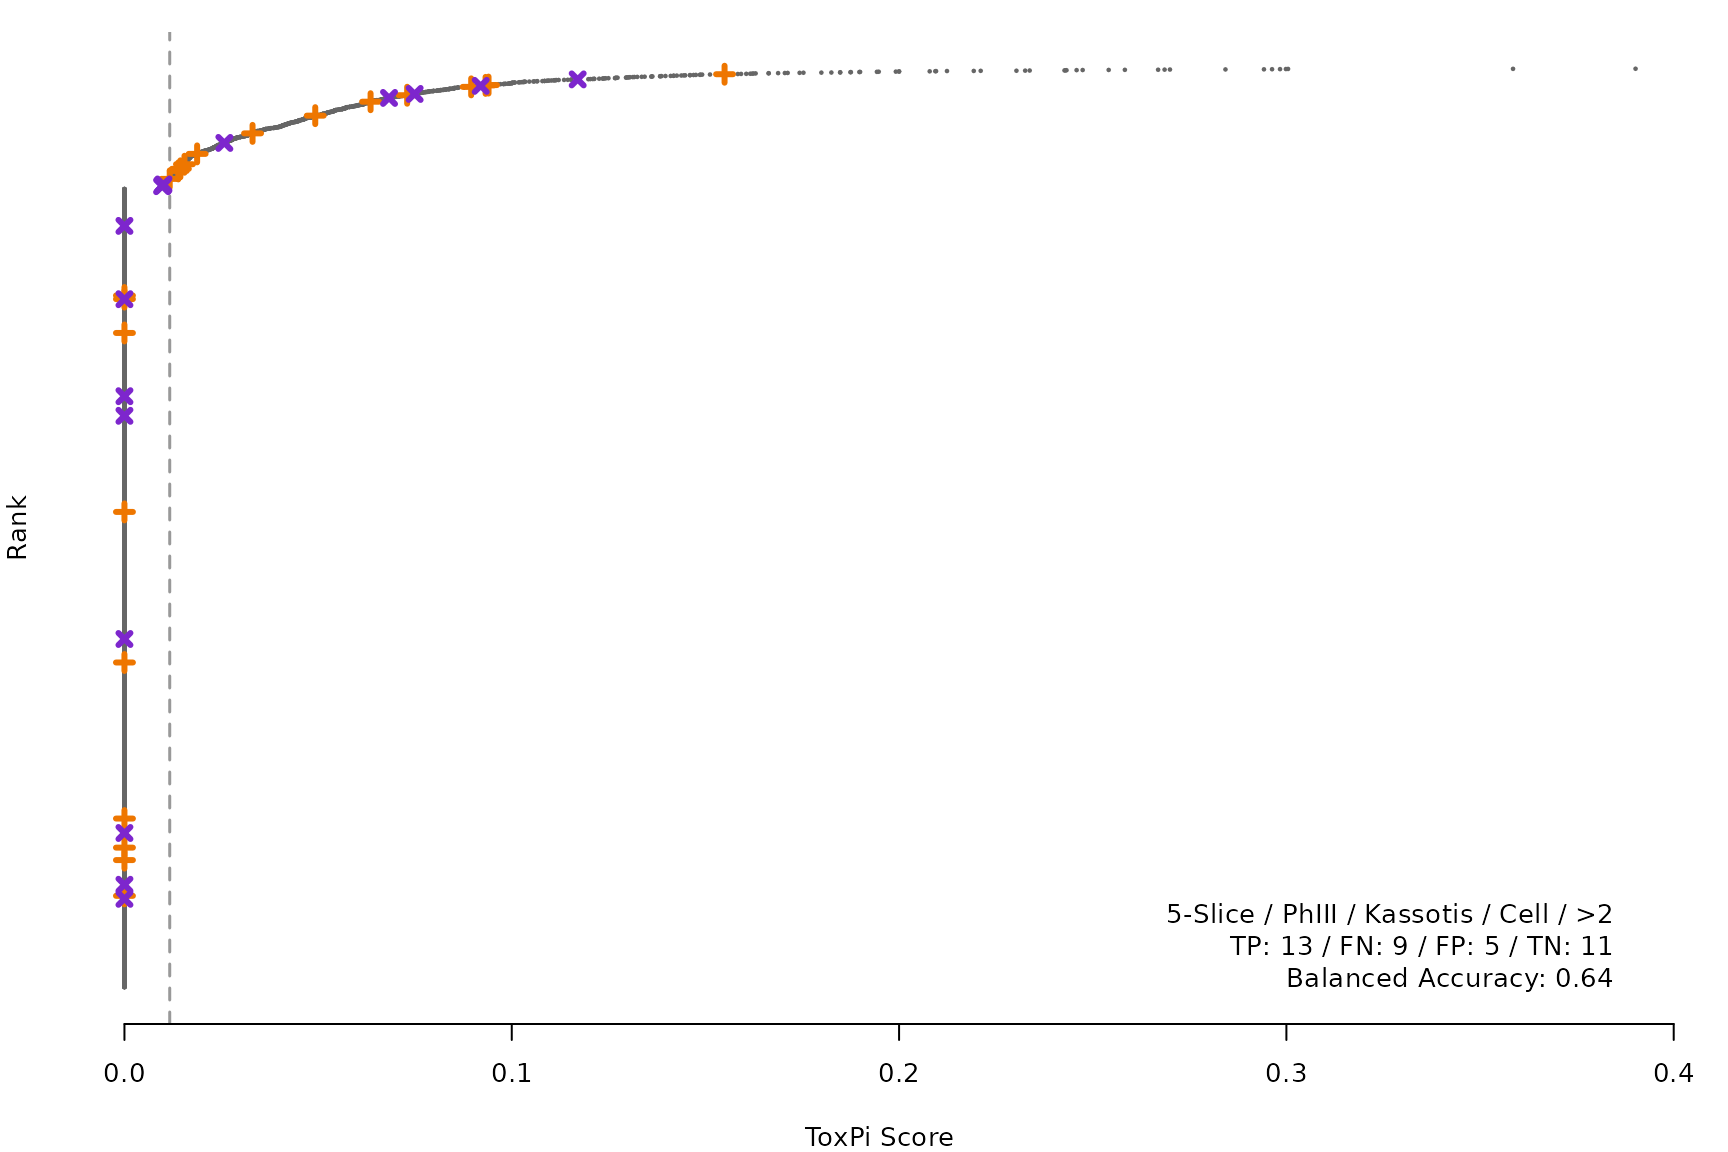
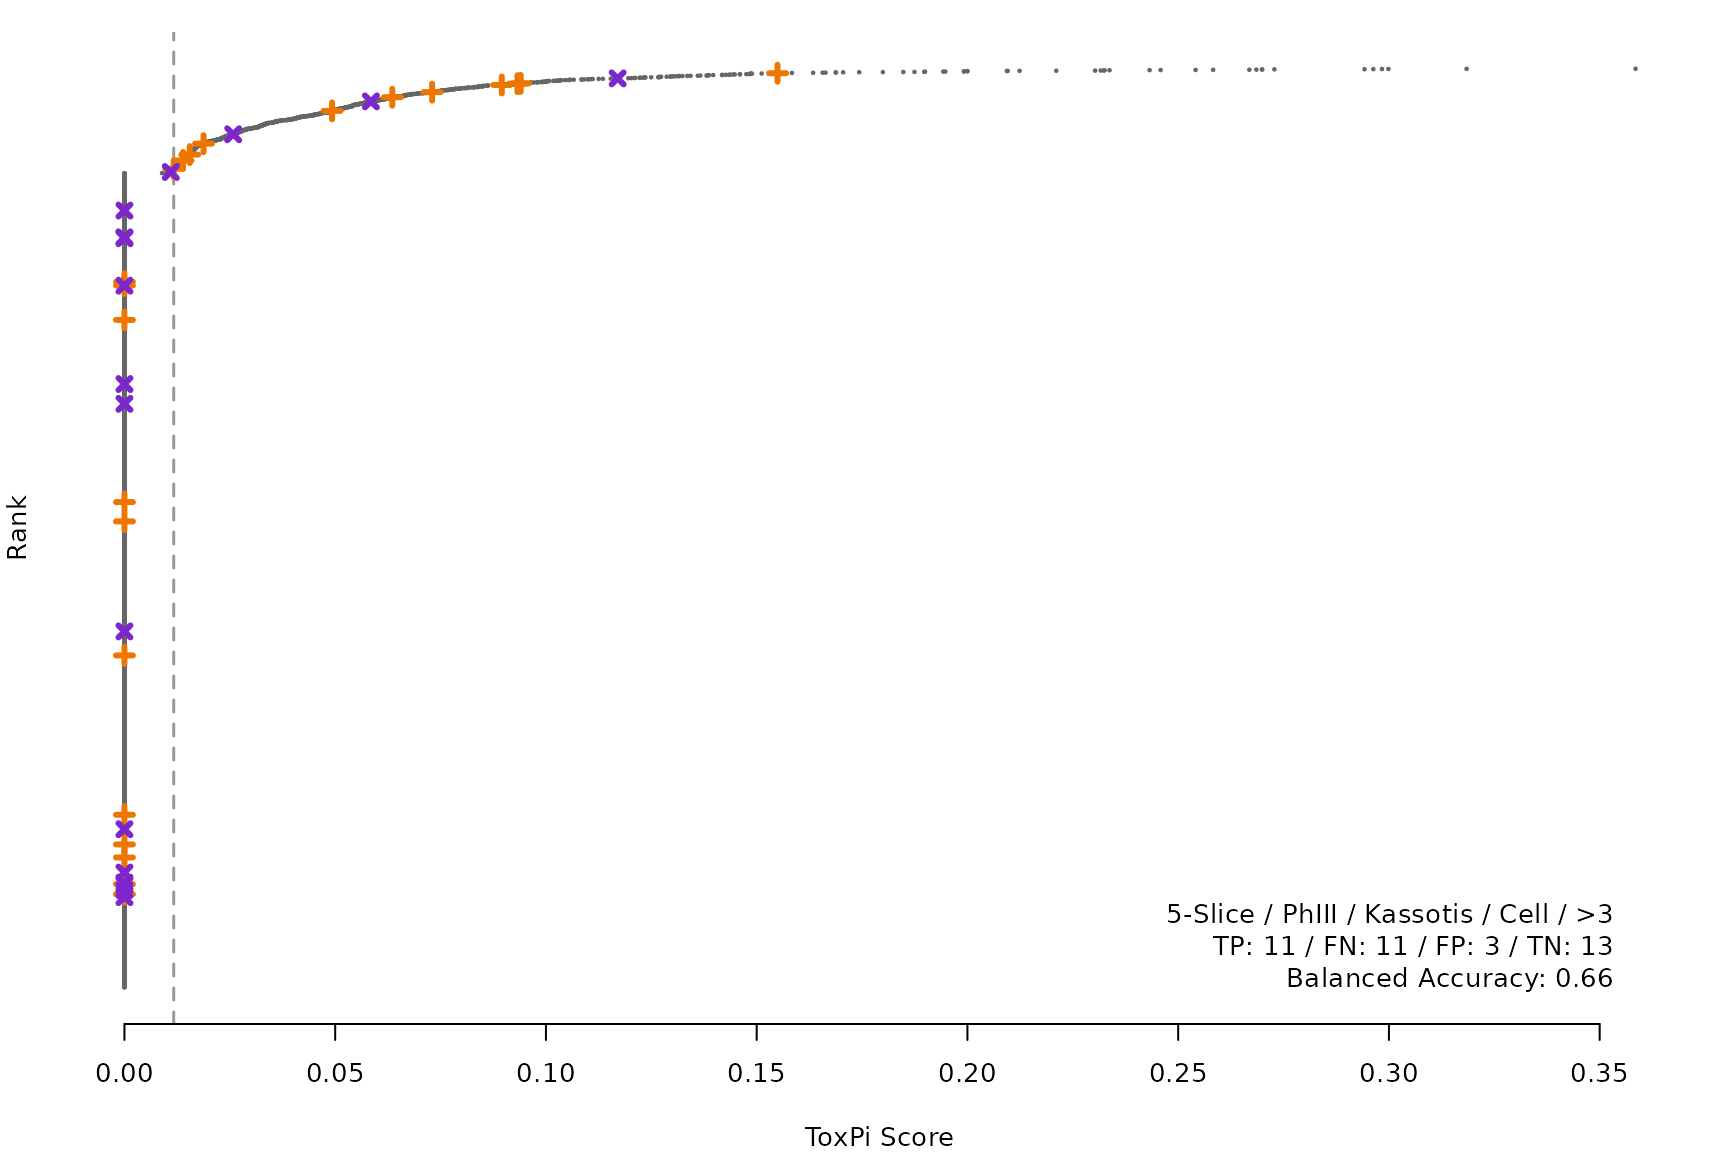
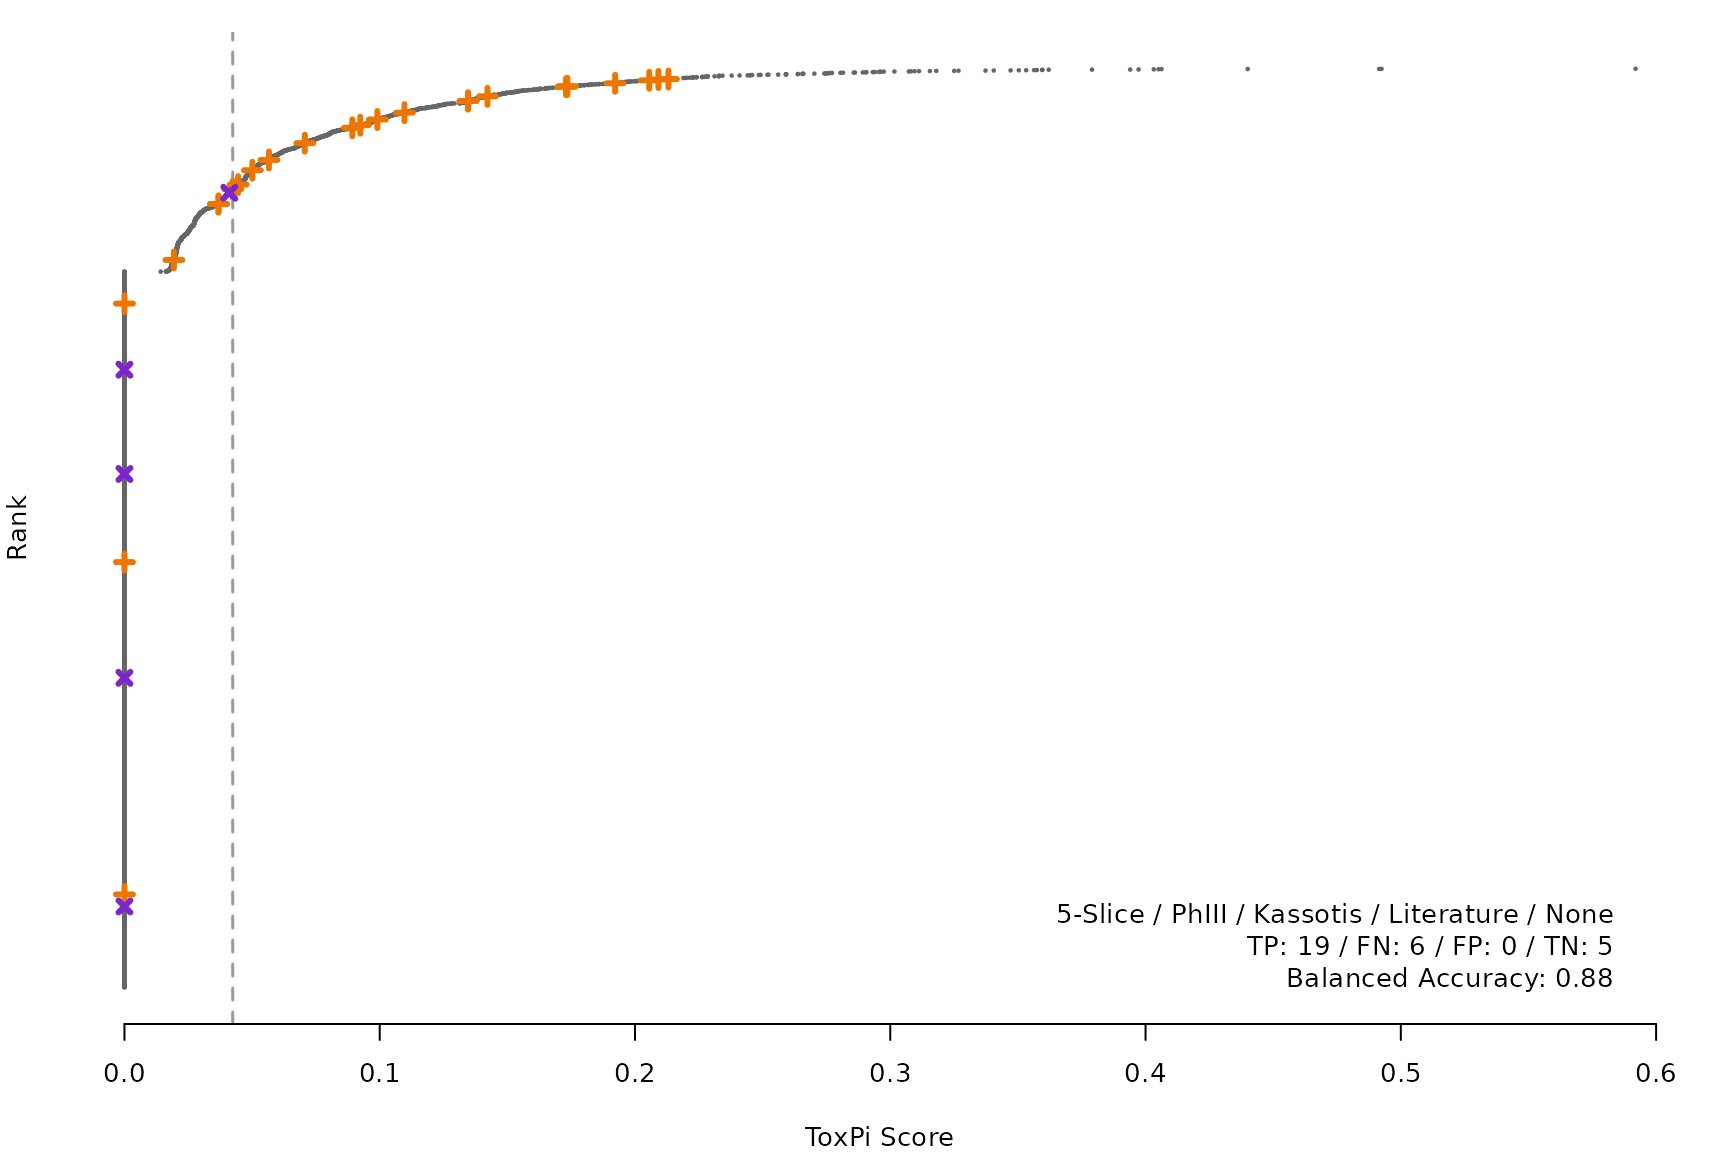
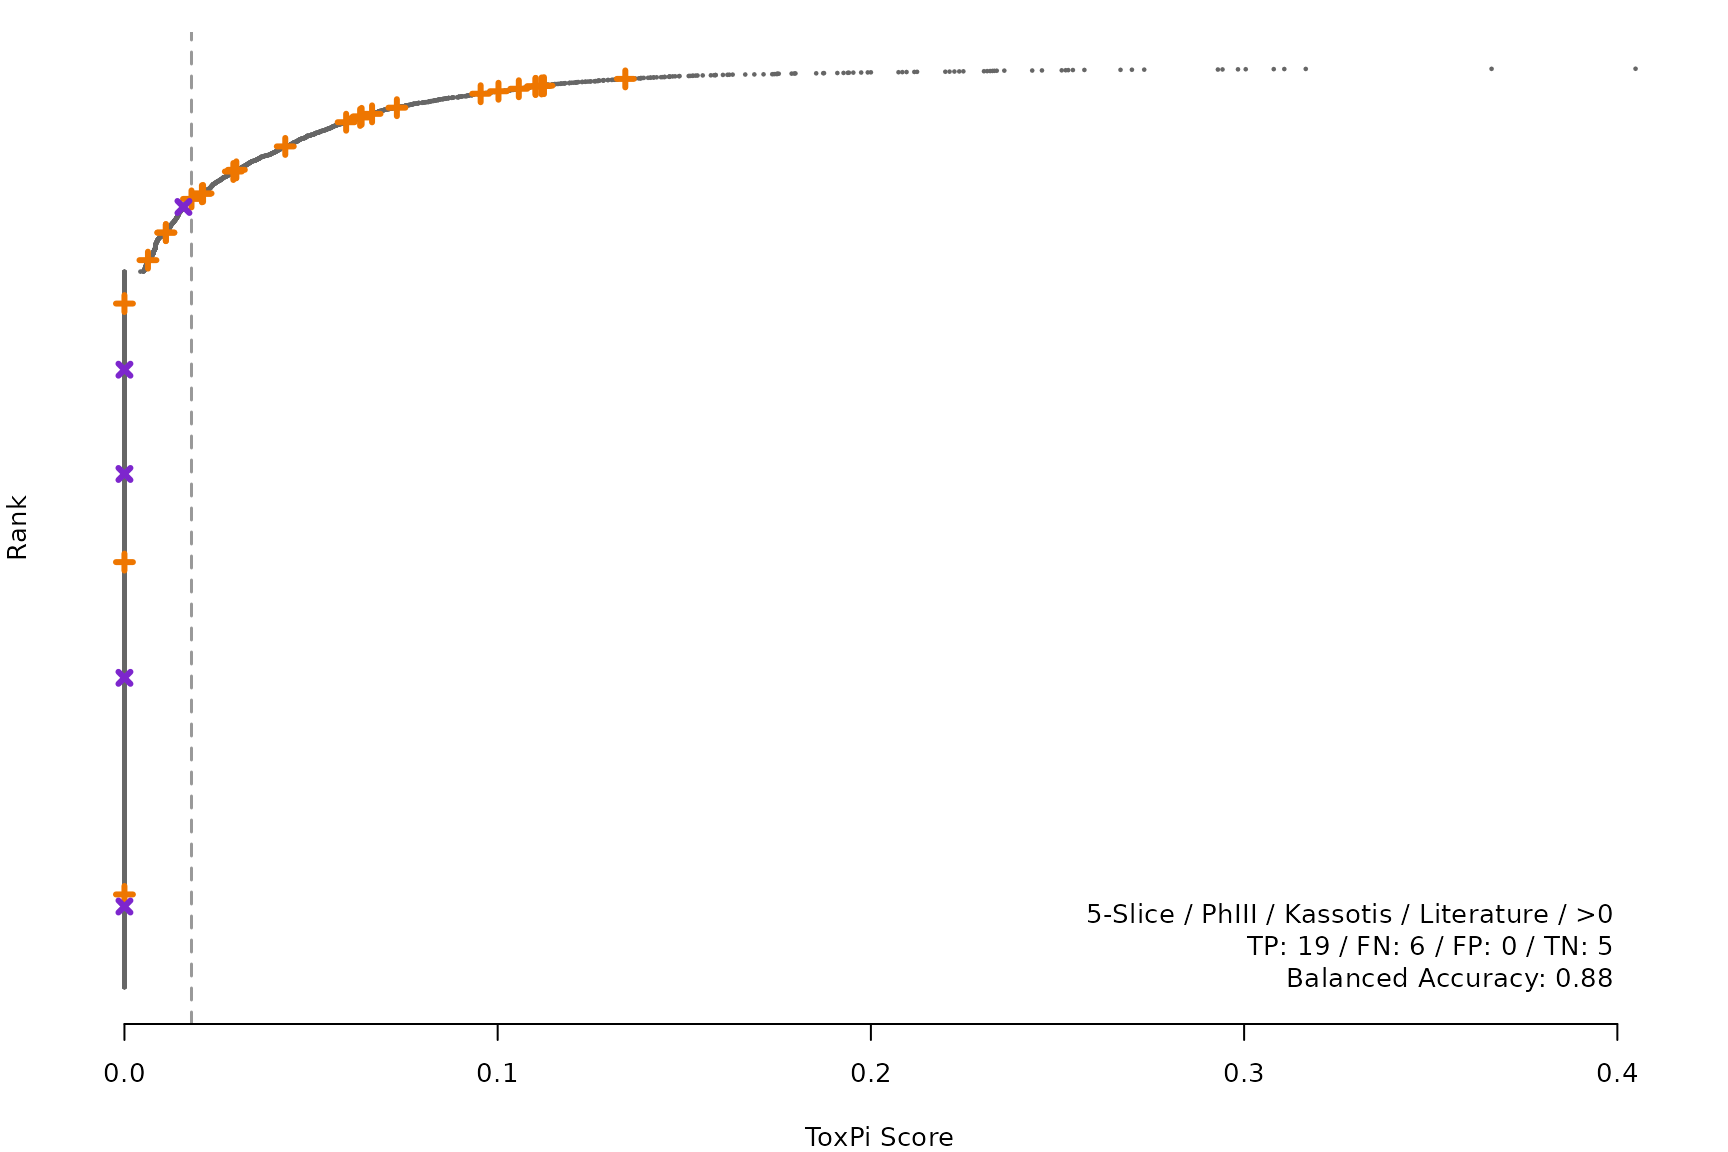
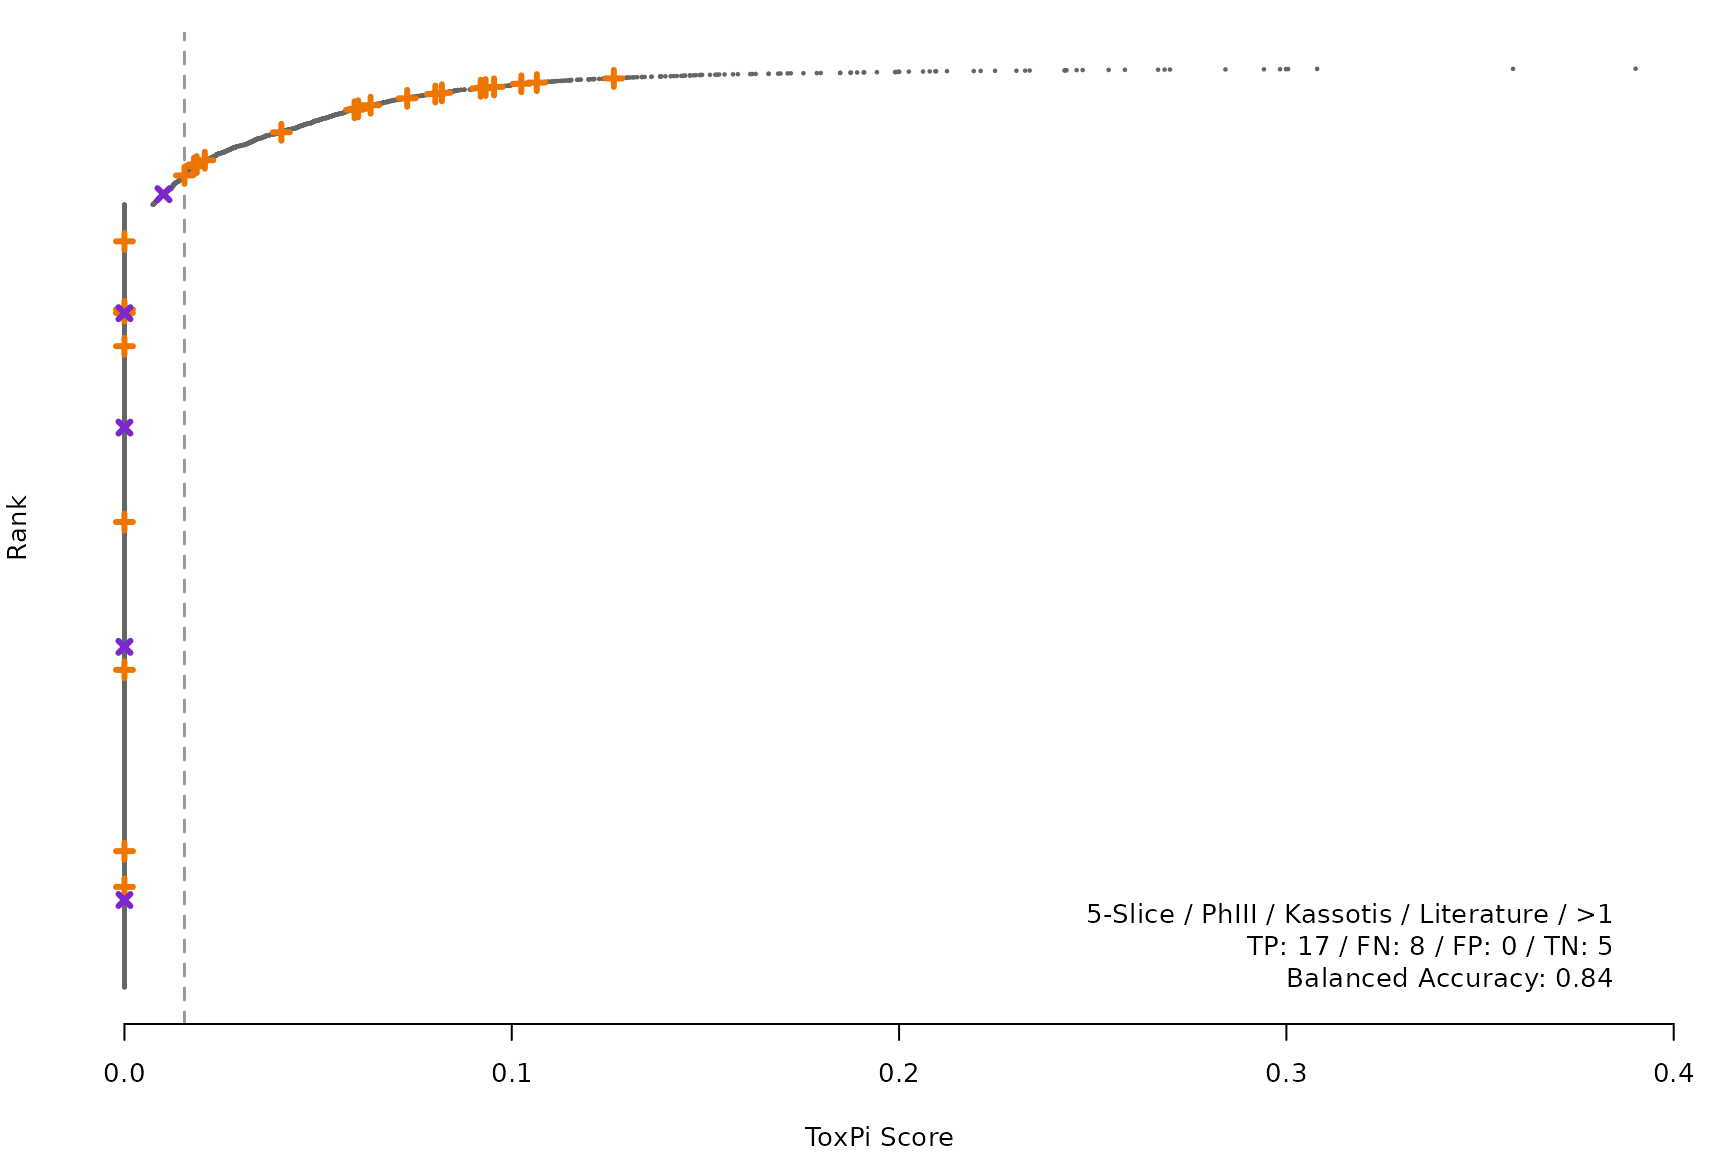
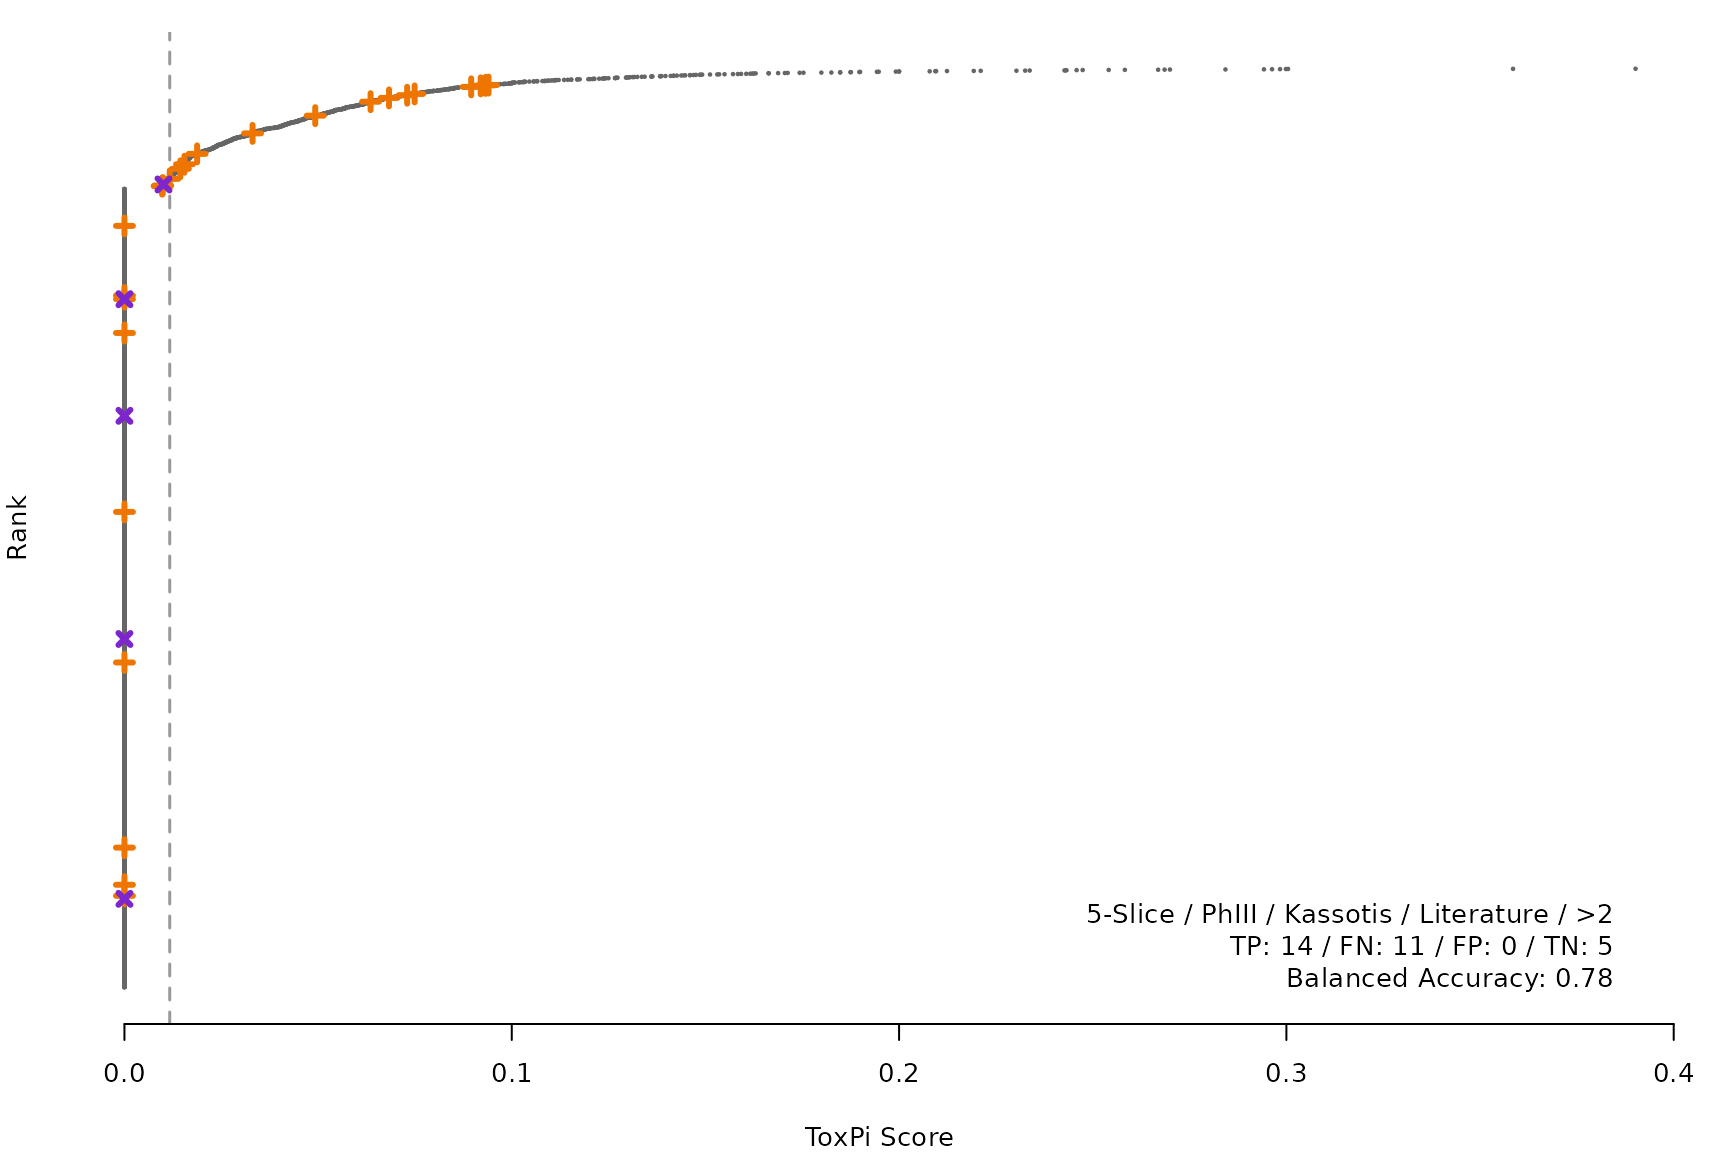
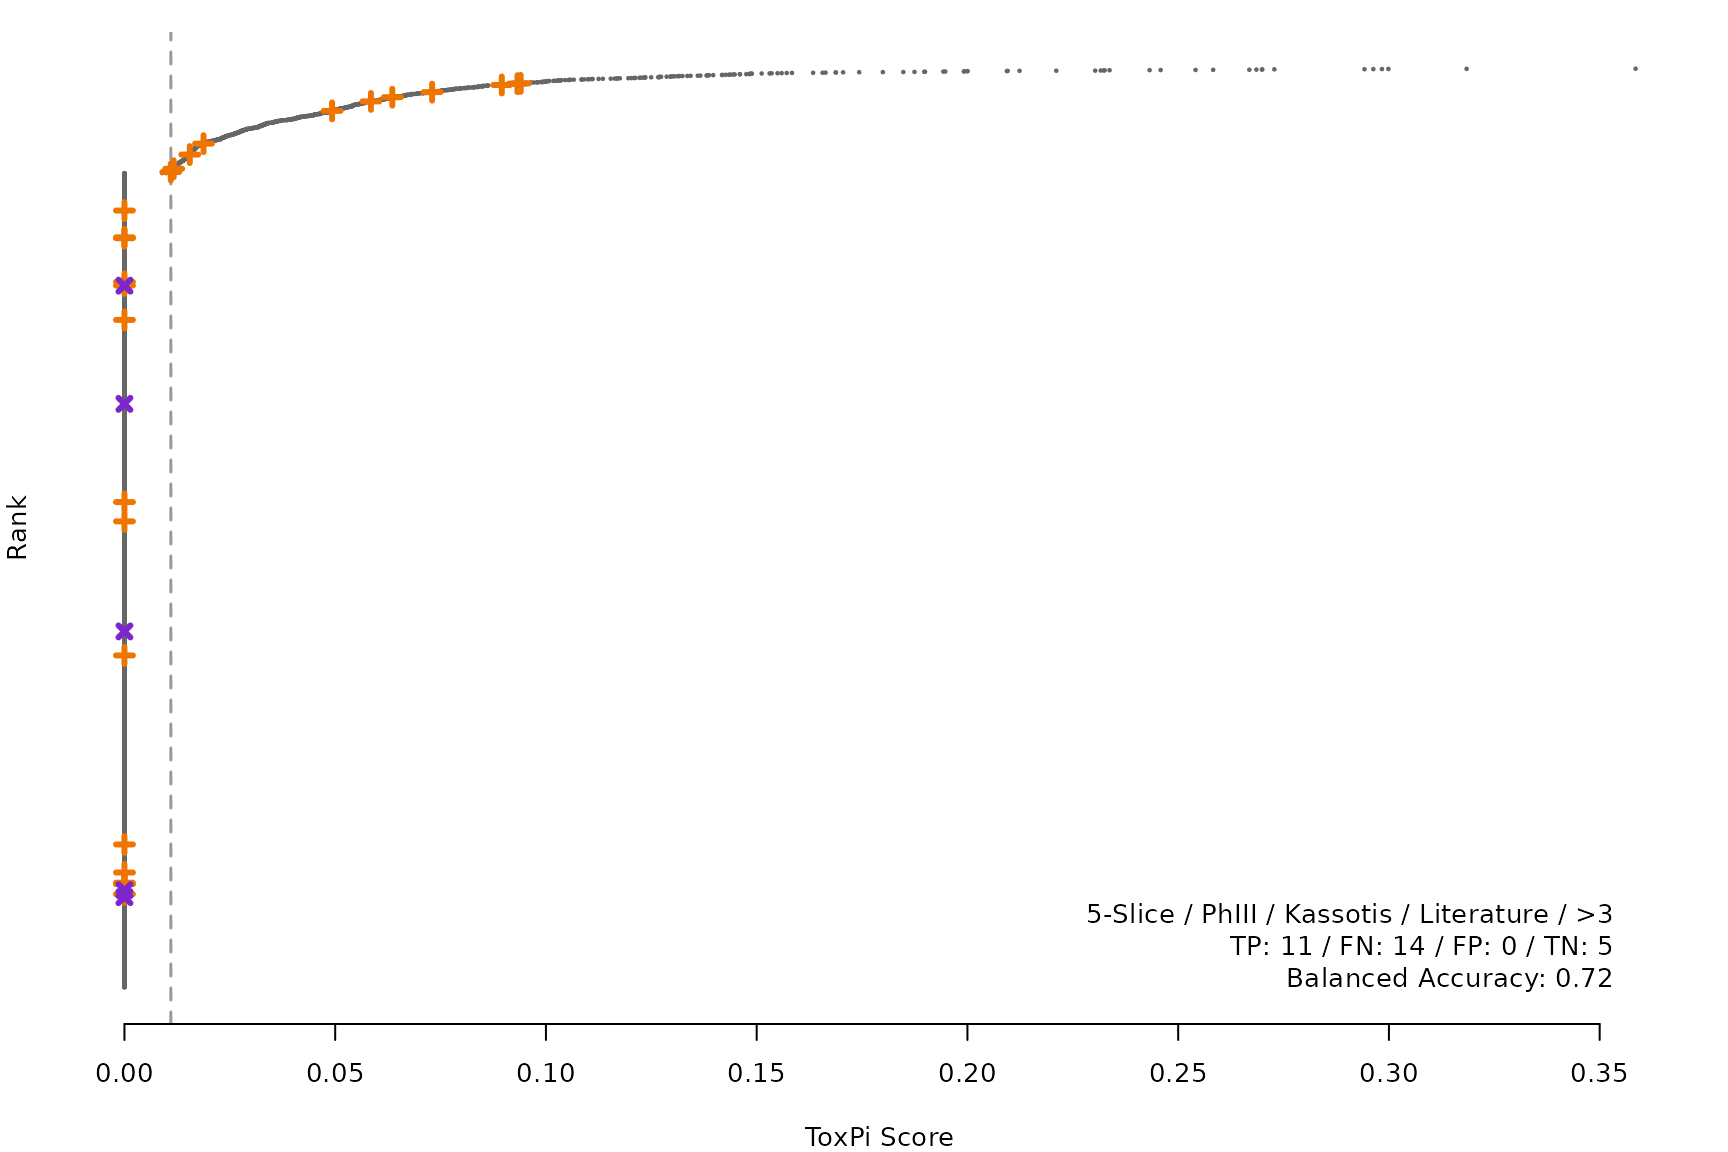
makeRankPlot <- function(i) {
scr <- allScores[[smryTbl[i, scr]]]
ref <- get(tolower(smryTbl[i, CtrlSet]))
refCol <- if (smryTbl[i, CtrlType] == "Cell") "cellActive" else "litActive"
rankPlot(res = scr,
posChems = ref[get(refCol), code],
negChems = ref[!get(refCol), code],
coff = smryTbl[i, cutpoint])
lgnd1 <- smryTbl[i, lapply(.SD, as.character)[1:5]]
lgnd1 <- paste(lgnd1, collapse = " / ")
lgnd2 <- smryTbl[i, .(TP, FN, FP, TN)]
lgnd2 <- paste(sprintf("%s: %s", names(lgnd2), unlist(lgnd2)),
collapse = " / ")
lgnd3 <- paste("Balanced Accuracy:", smryTbl[i, round(BalancedAccuracy, 2)])
text(x = grconvertX(0.95, from = "npc"),
y = grconvertX(0.05, from = "npc"),
adj = c(1, 0),
paste(c(lgnd1, lgnd2, lgnd3), collapse = "\n"),
offset = 0)
}
for (i in smryTbl[ , .I[!is.na(Model)]]) makeRankPlot(i)